QP - Long form (English)
Quarterly Performances - Long form

https://www.youtube.com/@issuetracker-info
by andy

[1/2] Analyzing Market Reactions Post Trump's Election

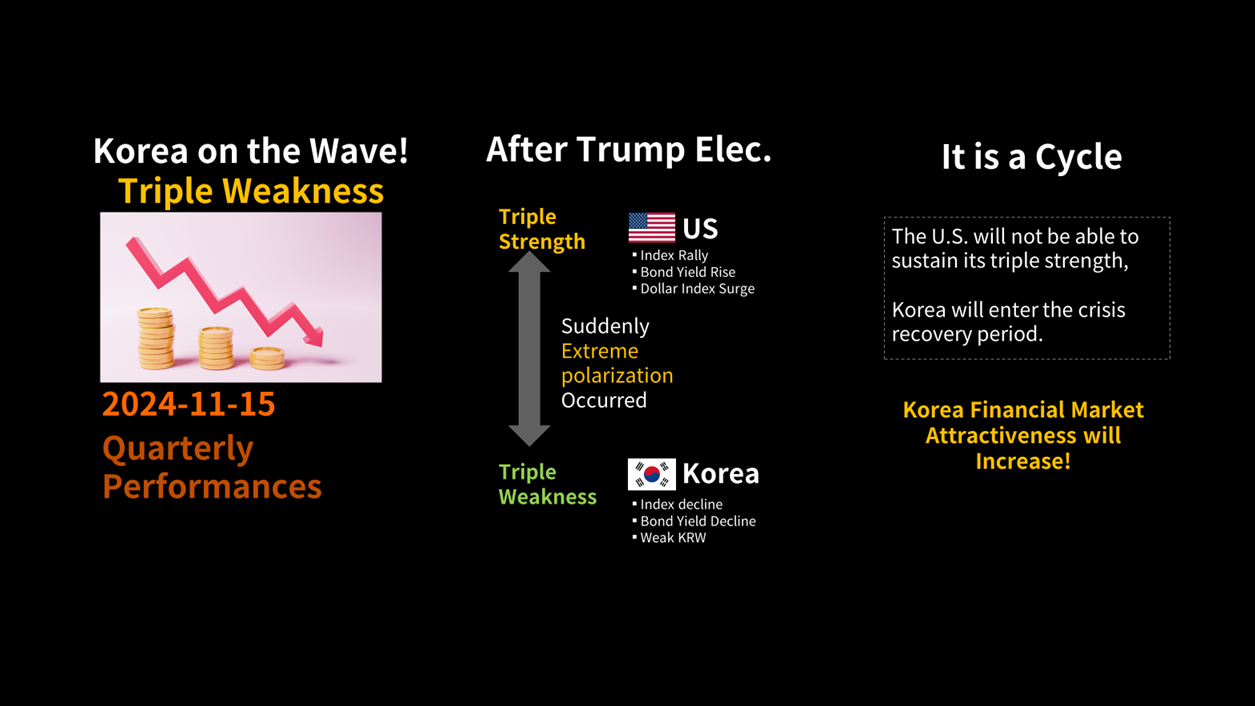
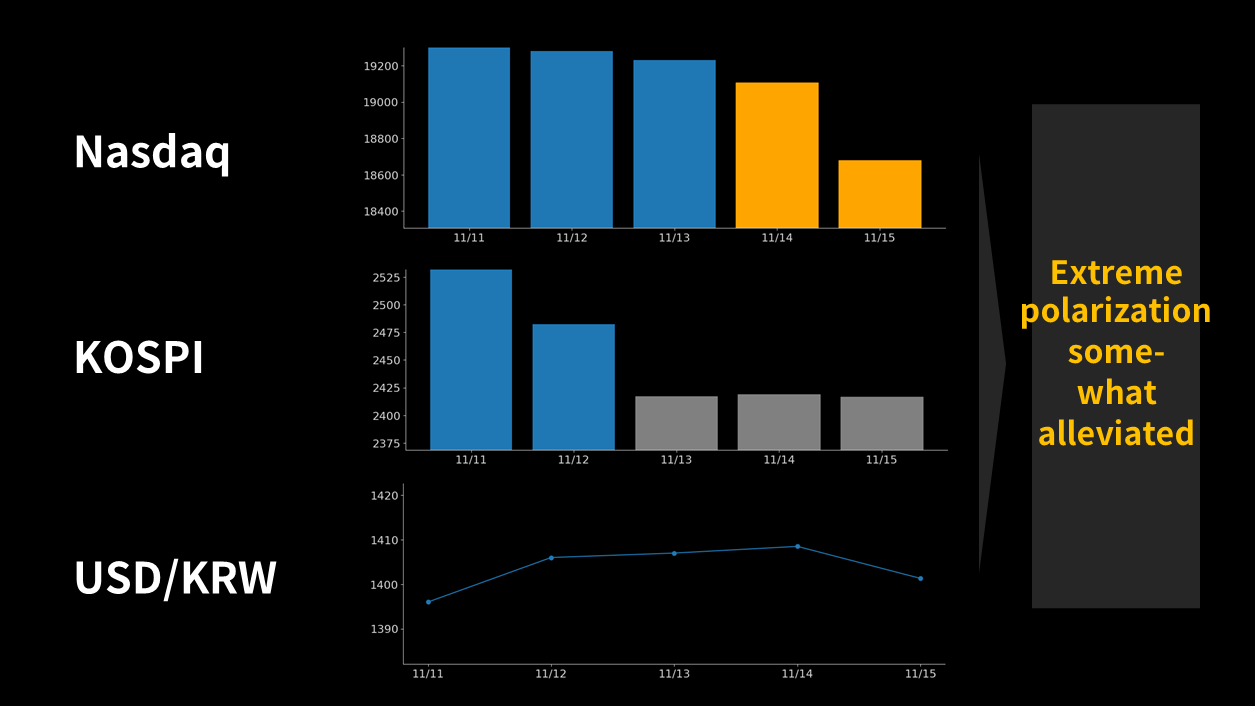
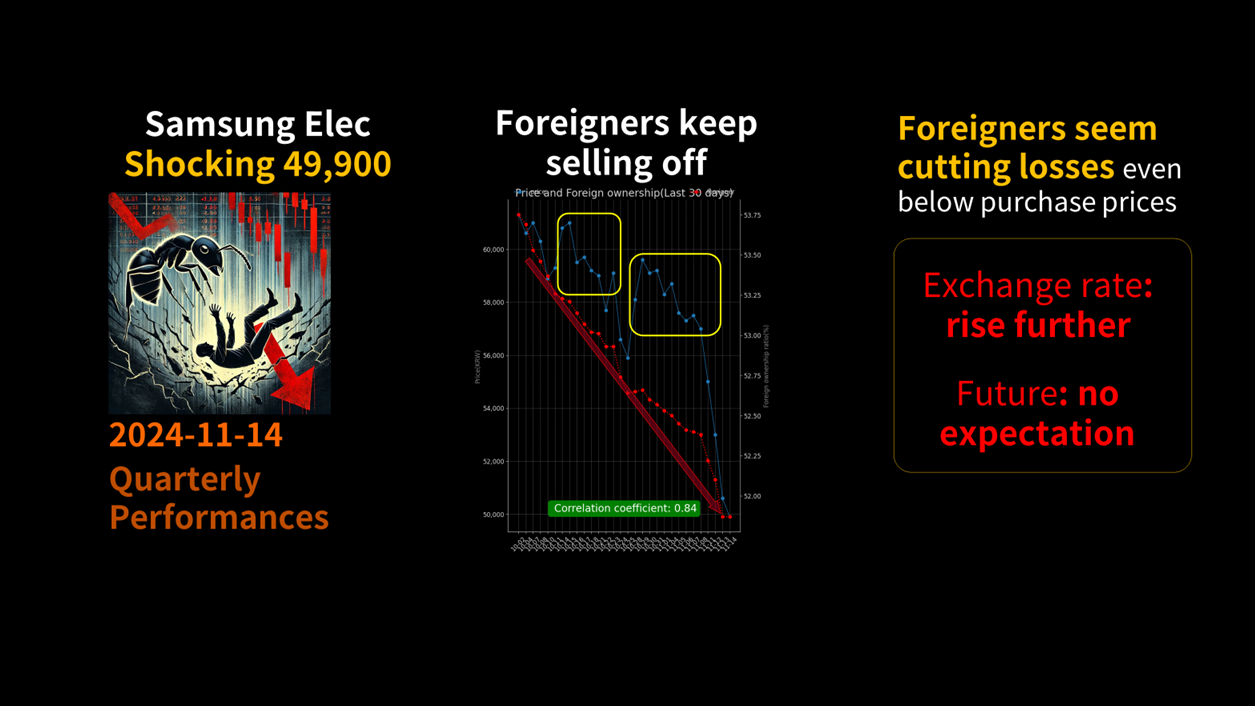
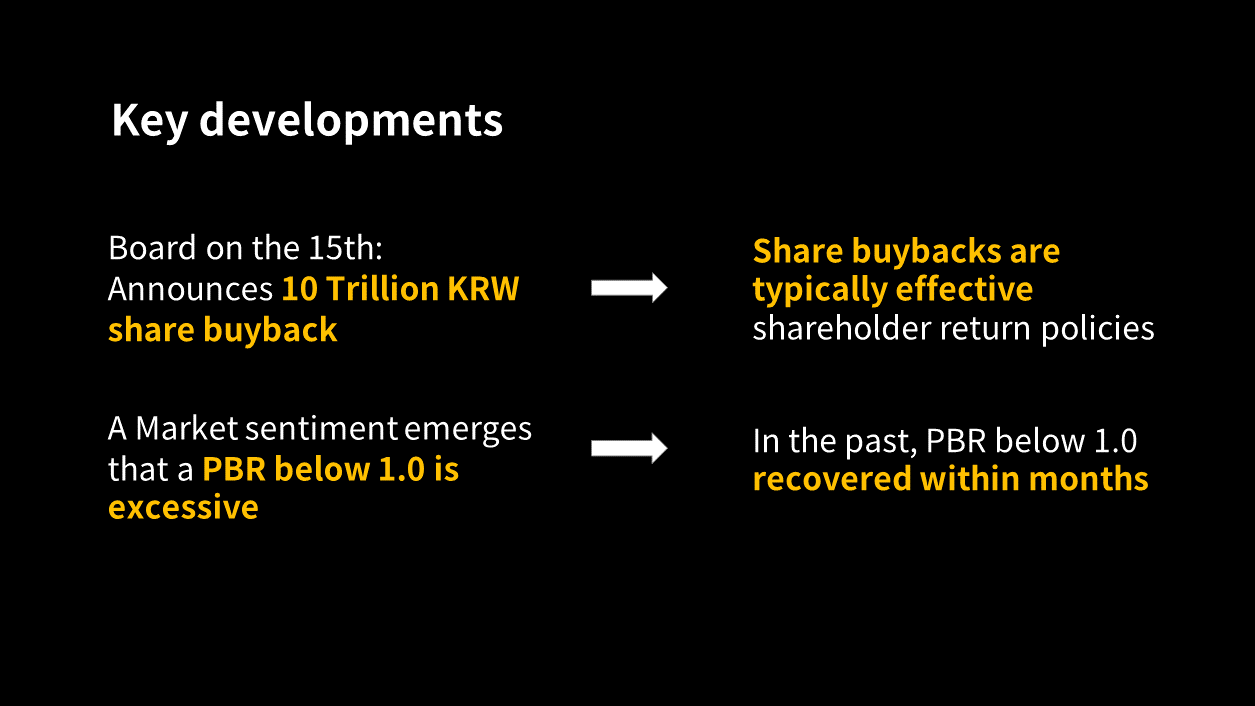
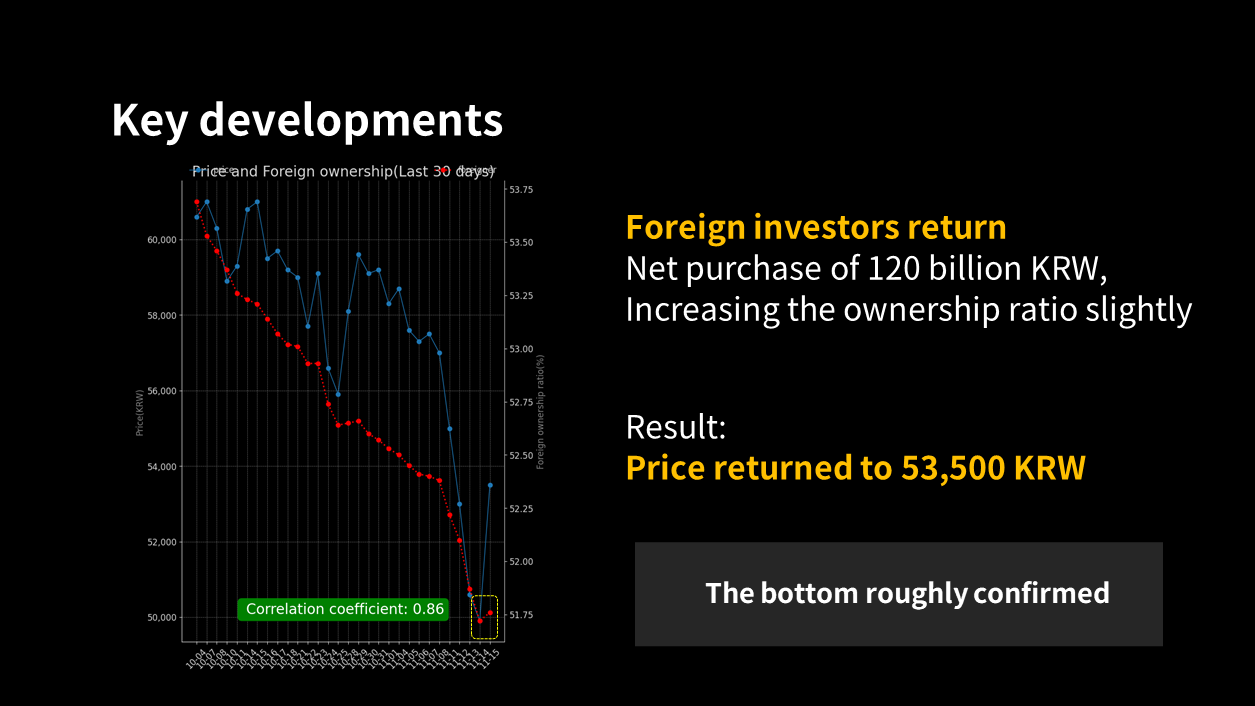
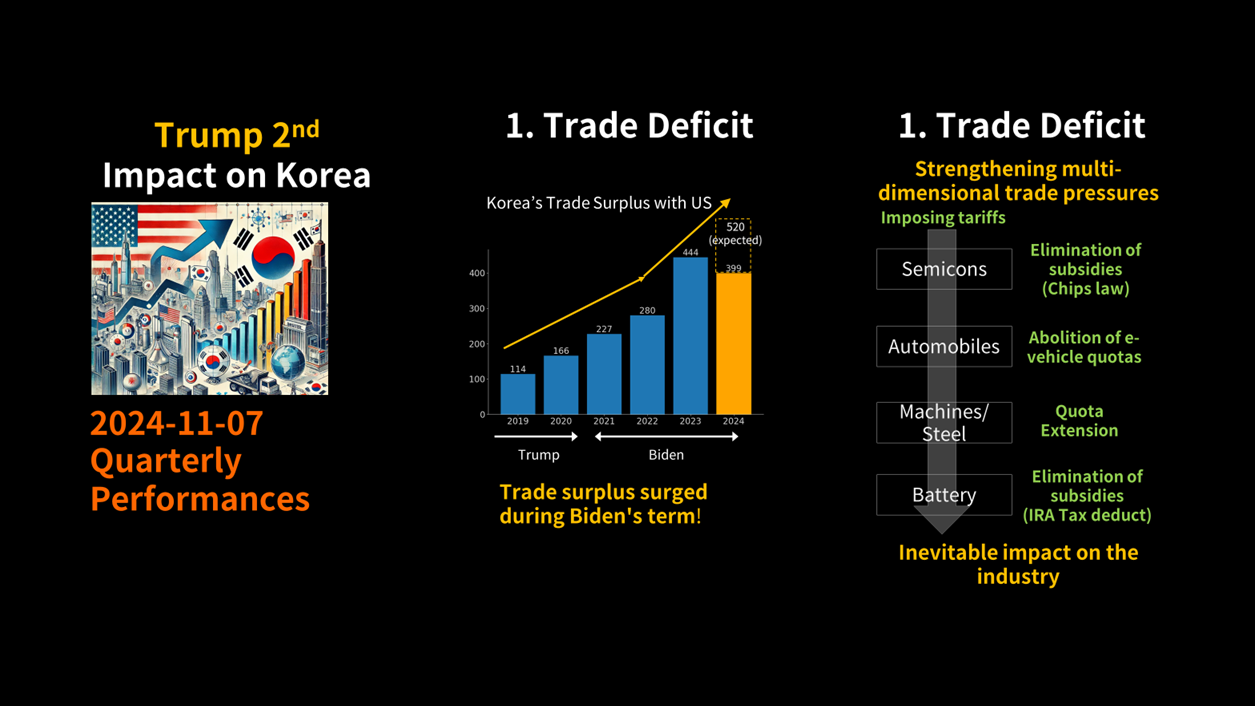
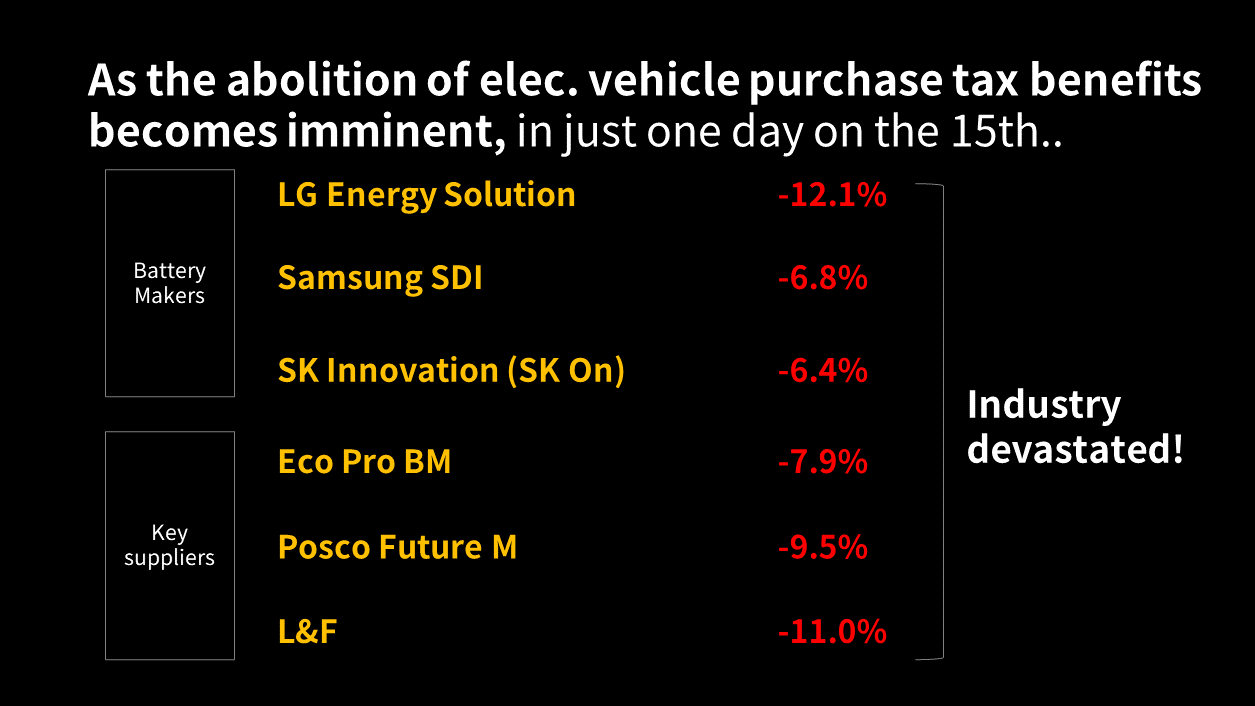
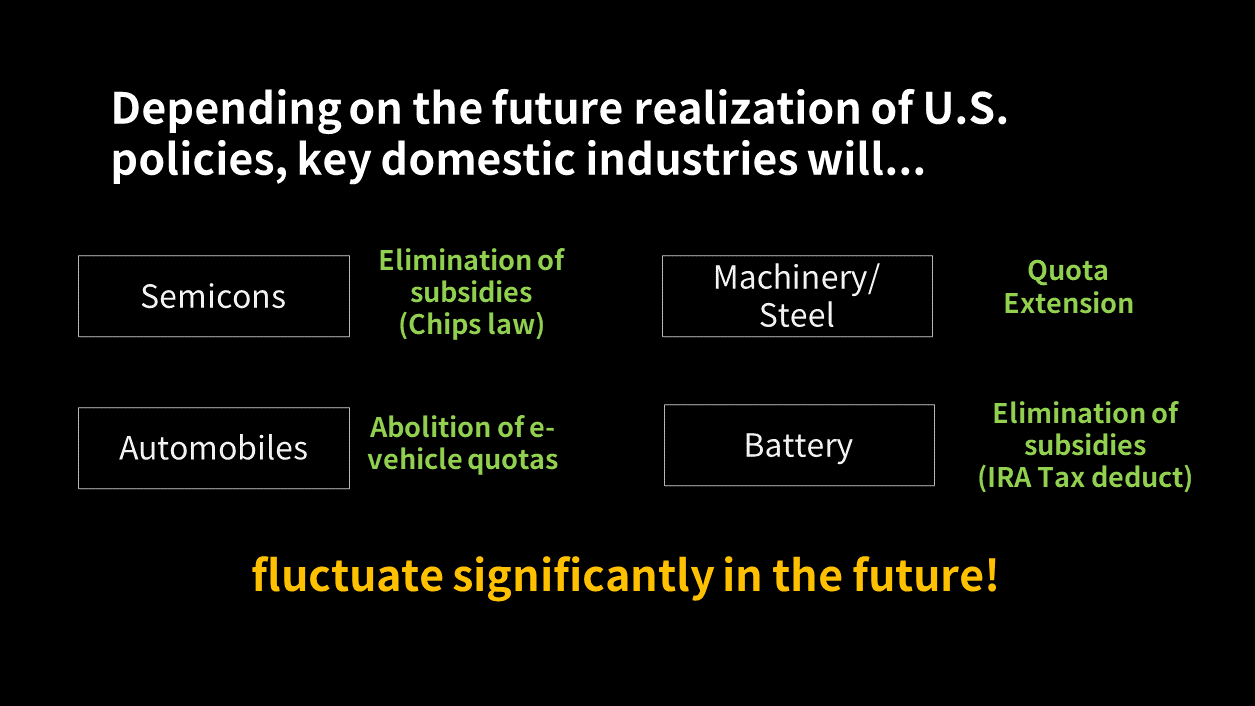
[1/2] In this video, I summarize the crucial developments in the stock market after Trump's election. We explore Samsung Electronics' recent performance, the market's response, and the potential impact of U.S. policies on domestic industries. Stay tuned for insights and analysis on these key issues! (p1) Since Trumps election, I will take some time to summarize the progress on the key issues I discussed through Shorts. (p2) We do not offer investment advice. (p4) On November 14th, Samsung Electronics closing price dropped to the 40,000 won range, and I analyzed this situation and reported it. (p5) I will summarize what happened afterward. First, Samsung Electronics announced an emergency buyback and retirement of its own shares worth 10 trillion won. Typically, the buyback and retirement of shares is considered a more efficient shareholder return policy compared to dividends or other methods, which led to a positive market reaction. Also, it seems that the perception in the market was that a PBR below 1.0 was too severe. In the past, situations where the PBR fell below 1.0 have typically recovered within a few months. (p6) Consequently, on November 15th, foreign investors made a net purchase of about 120 billion won, resulting in a slight rebound in shareholding ratio, and the stock price surged significantly, eventually closing at 53,500 won. Though its unfortunate that it dropped so far, I believe we have confirmed the bottom. (p8) Additionally, on November 7th, shortly after Trumps election, I analyzed the impact of his secondterm policies on domestic industries. There was a suggestion that various industries would be affected to address the U.S. trade deficit. (p9) In reality, Trump recently reaffirmed that tax benefits for electric vehicle purchases would be eliminated, and even Musk reportedly agreed with this, prompting the market to react within a day. As you can see, batteryrelated stocks were completely devastated. The vulnerability of the domestic industrial structure is becoming increasingly apparent. (p10) Going forward, domestic leading industries are expected to swing significantly depending on the realization of U.S. policies. This should be seen as a foreseeable future. Youtube Link - Issue Tracker

[2/2] SK Hynix vs. Samsung Electronics: A Deep Dive

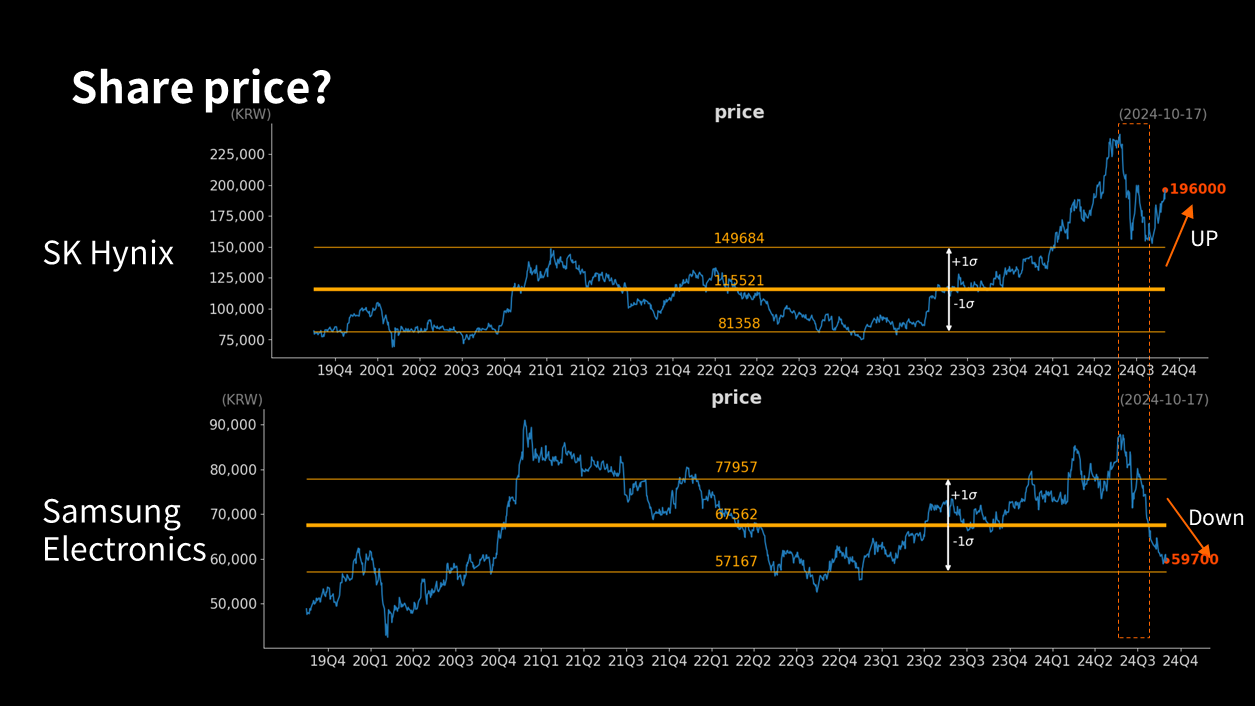
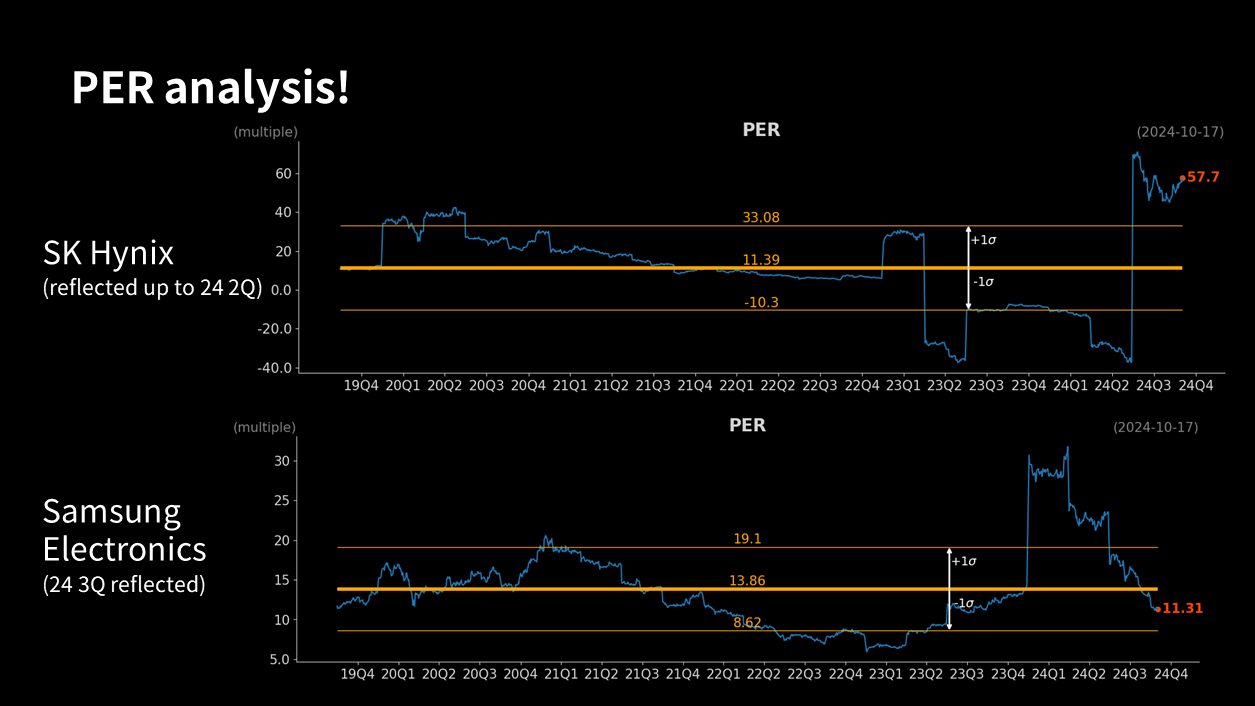
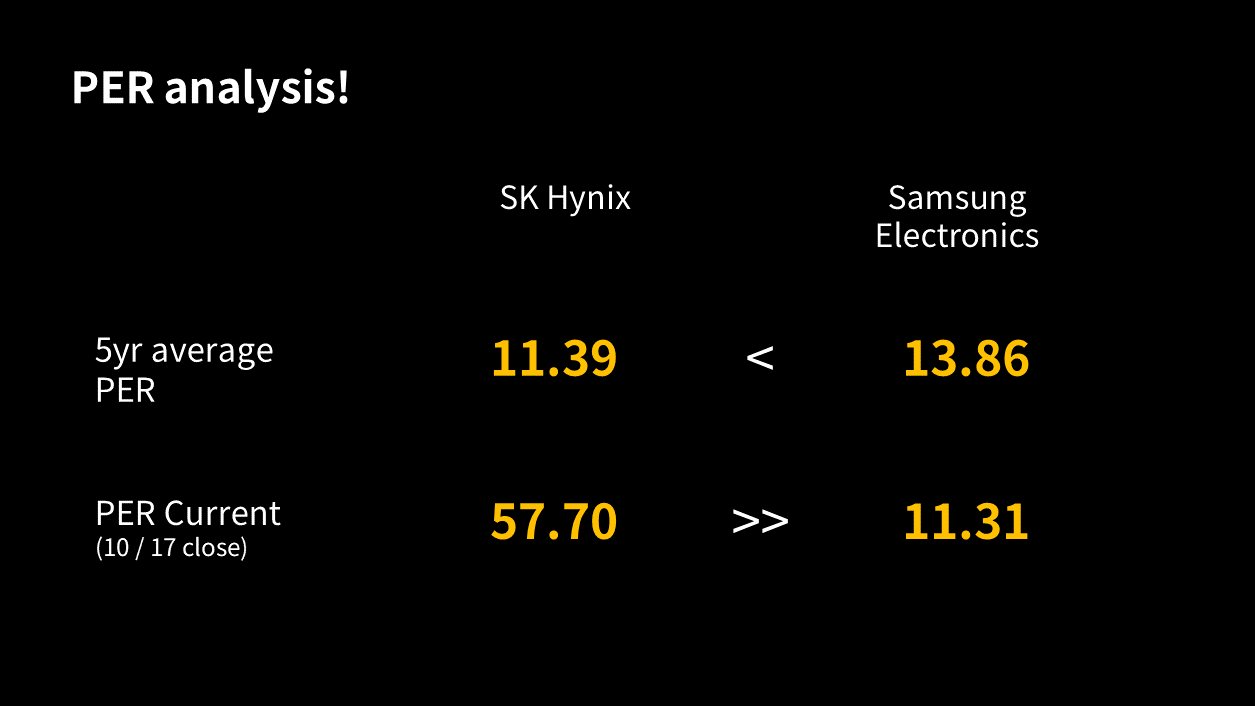
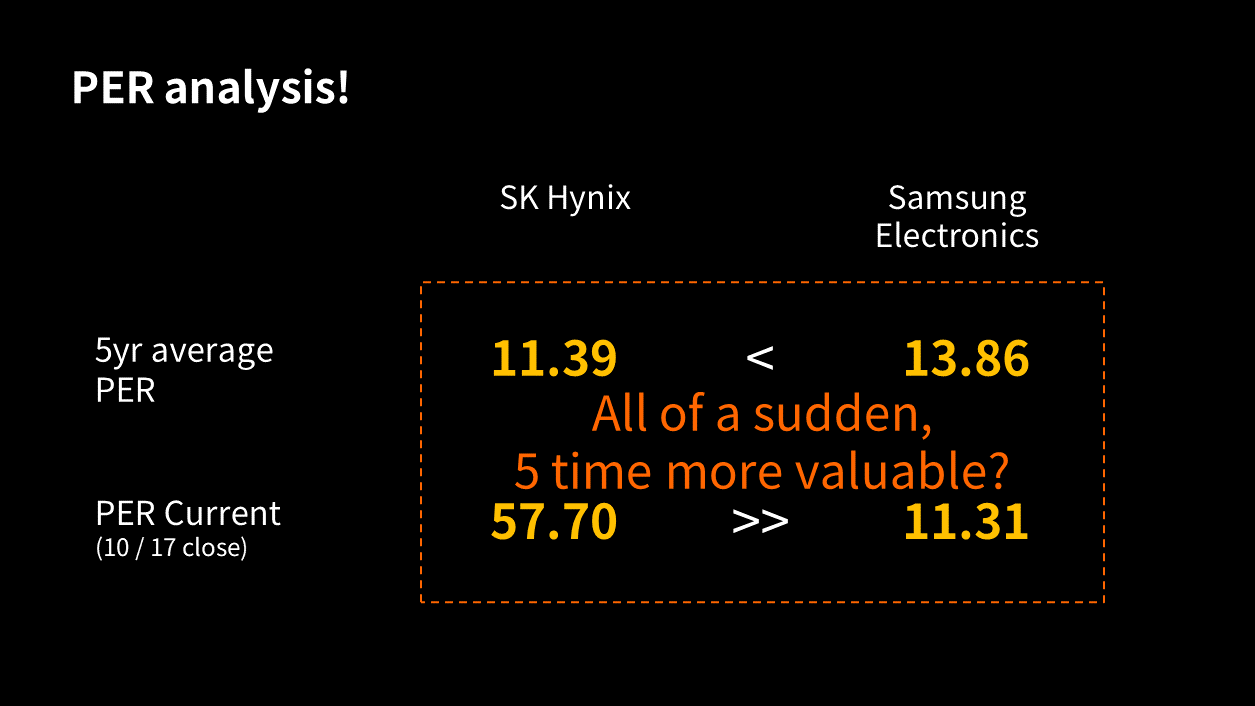
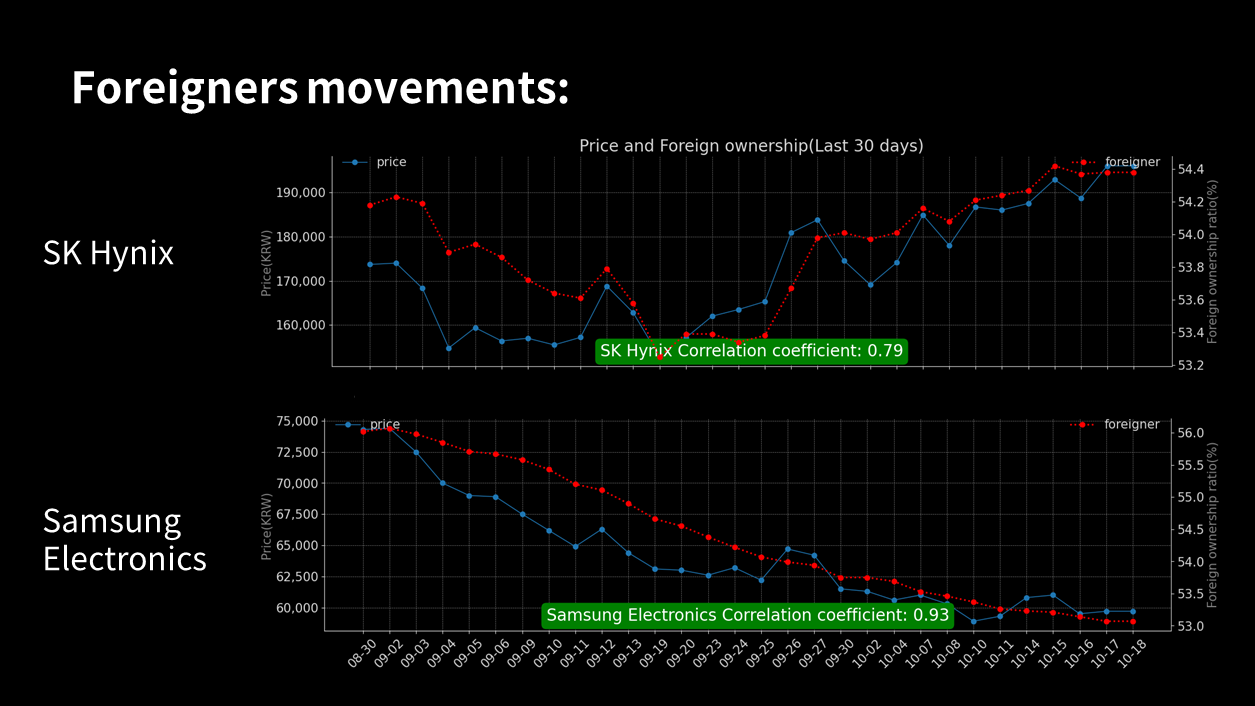
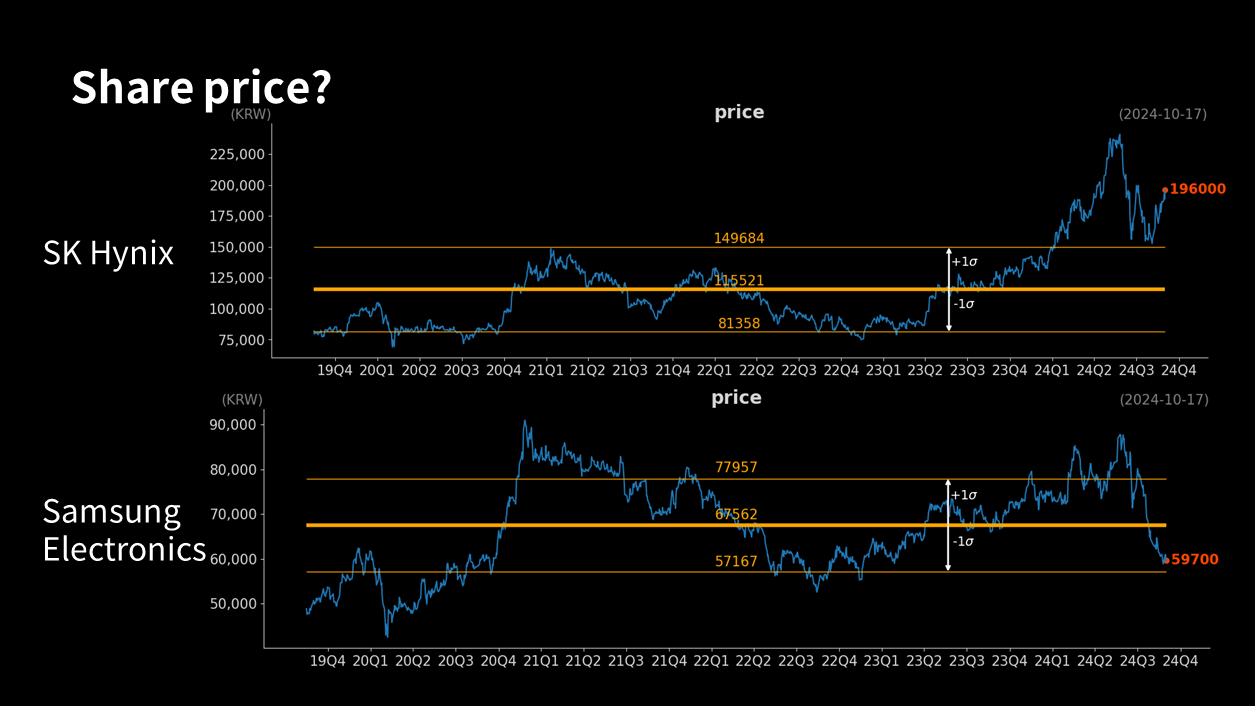
[2/2] In this video, we compare SK Hynix and Samsung Electronics, exploring their business structures, sales performances, and stock movements. Tune in for insights into the semiconductor sector and discover why the market views these companies so differently. This is not an investment recommendation, but rather an analytical overview. (p11) They moved similarly at first, but then SK Hynix rebounded while Samsung Electronics plummeted. Its not that a significant issue suddenly occurred, but at some point, the markets evaluation of both companies completely changed. There is a harsher assessment on the company that is falling, as if it has been waiting for such a decline. (p12) If we calculate the PER by dividing the net income of the last four quarters by the market capitalization, the two companies show a difference. Since performance changes every quarter, please be aware that there may be jumps in the PER calculation. Its not common to view PER in a time series, but I think its quite meaningful. SKs data only reflects up to Q2 performance, while Samsung Electronics includes estimated results for Q3 in its calculation. (p13) The results show that the average PER over five years is higher for Samsung Electronics. This indicates that the market has evaluated Samsung Electronics more highly over time. However, currently, SK Hynix has an overwhelmingly higher PER. Of course, the high PER may be partly due to losses in 2023, but the difference is still too large. (p14) Is it normal for such a reversal to happen suddenly, with nearly a fivefold difference? It seems reasonable to think that the market might be reacting excessively. (p15) Now, lets see what smart foreign investors think. Here is the correlation between foreign ownership rates and stock prices over the past 30 days. SK Hynixs foreign ownership rate declined somewhat before rising again, with a correlation to the stock price of about 0.79. Samsung Electronics foreign ownership rate has continuously decreased, yet it has an impressive correlation of 0.93 with its stock price. (p16) To summarize, while a simple comparison between the two companies is difficult, they are both currently affected by the same market issue regarding HBM, so I have boldly compared them. Looking at the PER, which reflects performance, it appears that the two companies are excessively evaluated differently. From a supplydemand perspective, it is clear that foreign investors are leading the decline in Samsungs stock price, while for SK Hynix, it seems that they are not driving the price up but rather adjusting their holdings by slightly increasing SK while reducing Samsung. I have provided this simple comparison, and at this moment, the strategy of going long on Samsung and short on SK Hynix might make sense, assuming the two companies cannot differ so significantly. Again, this is certainly not an investment recommendation. (p17) Thank you. Youtube Link - Issue Tracker

[1/2] SK Hynix vs. Samsung Electronics: A Deep Dive

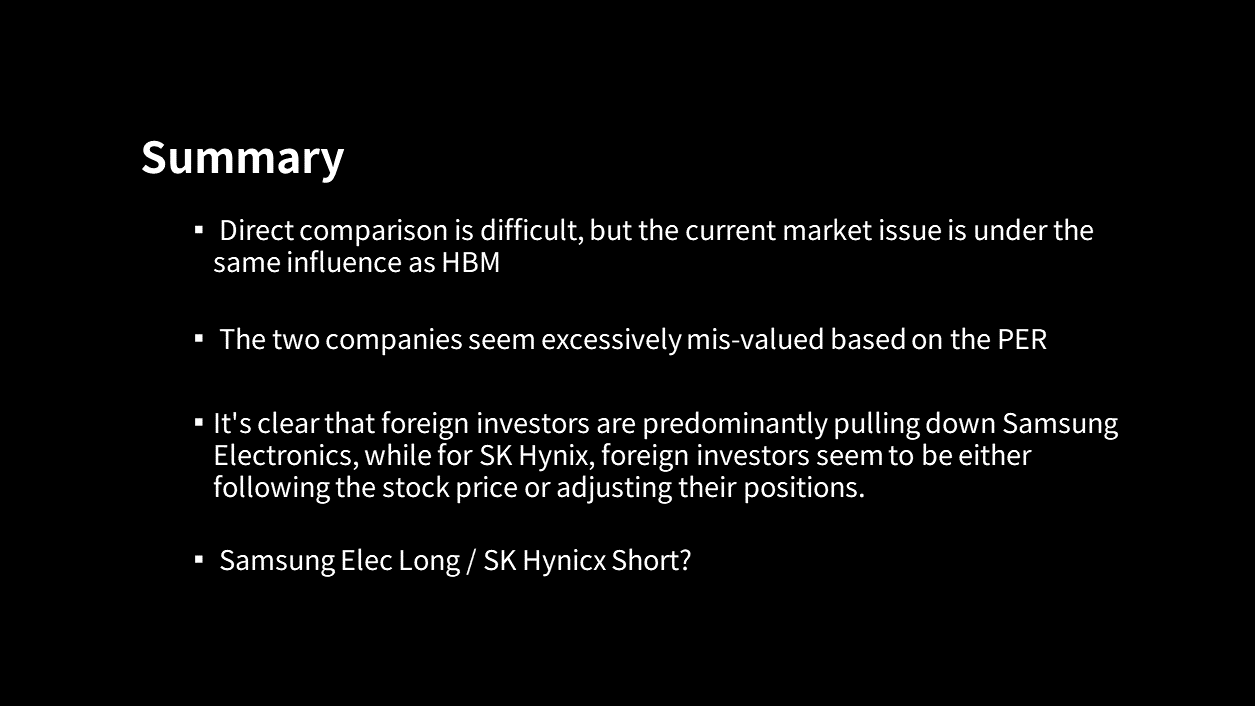
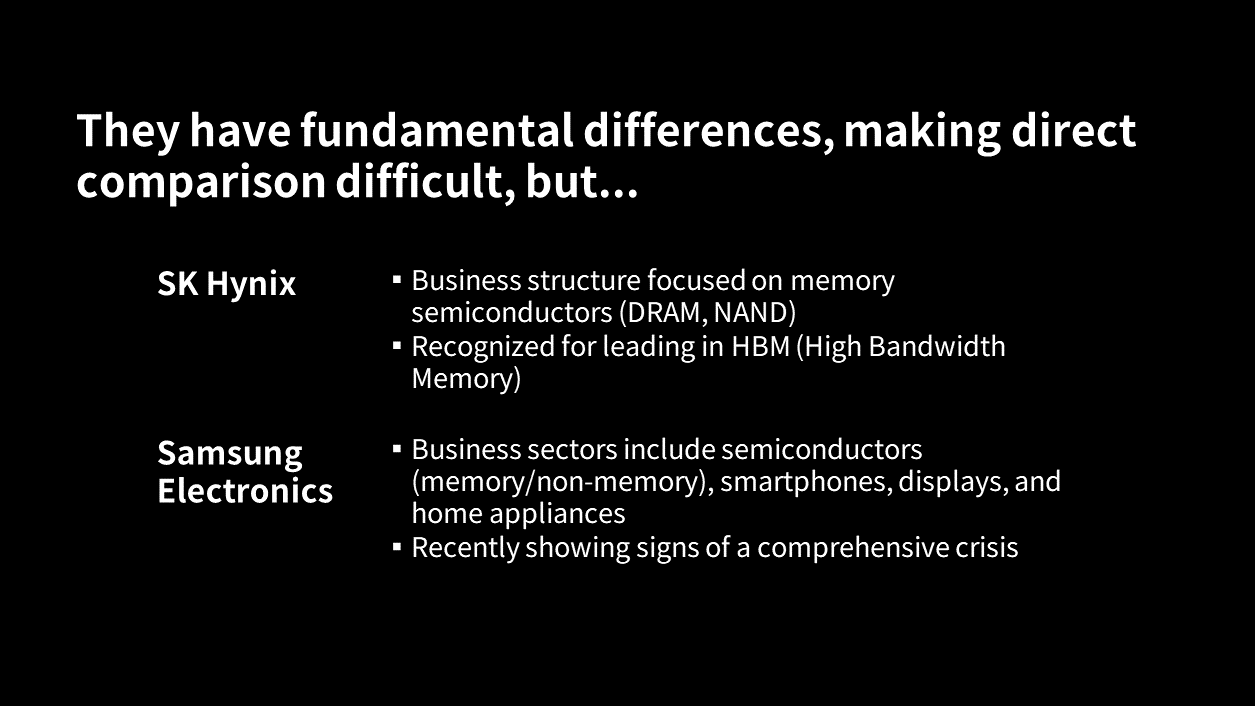
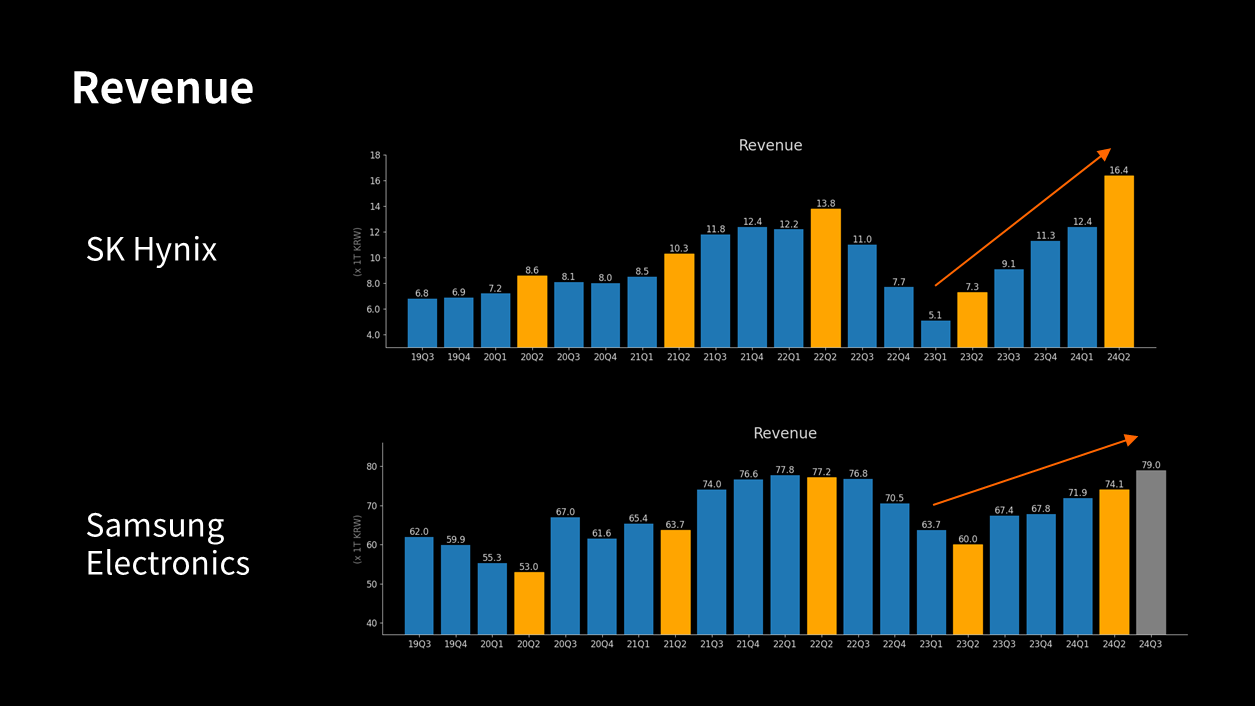
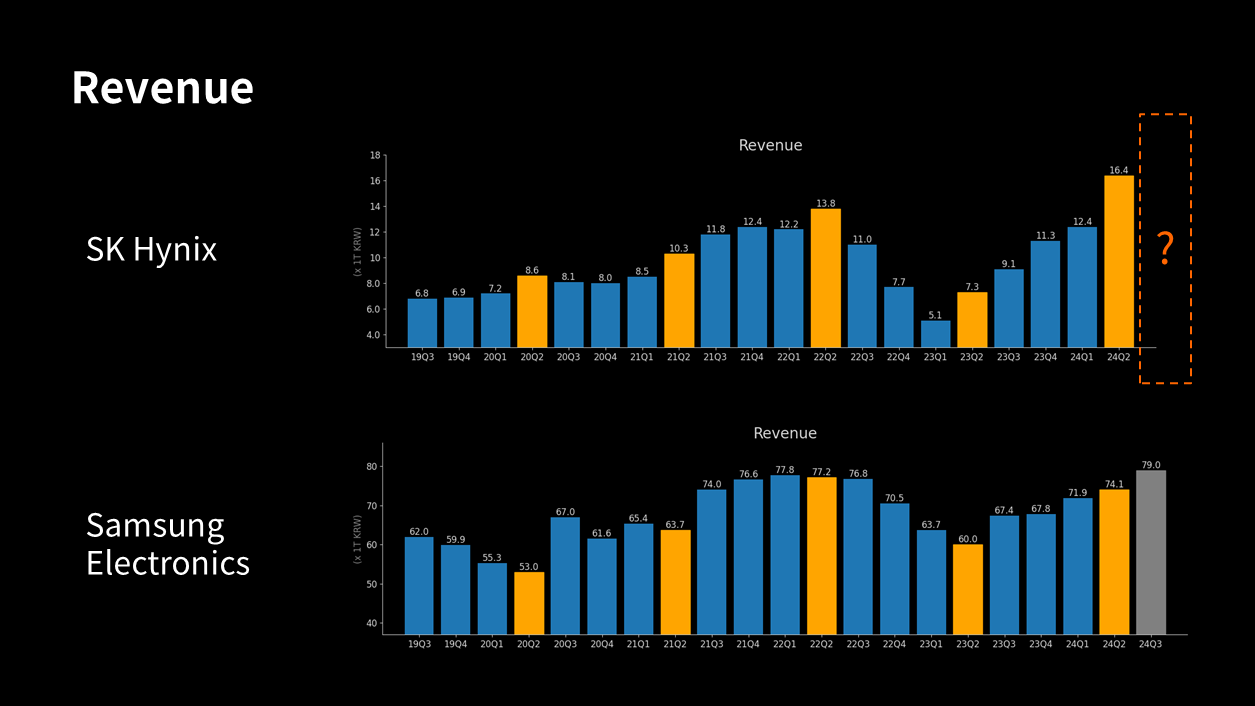
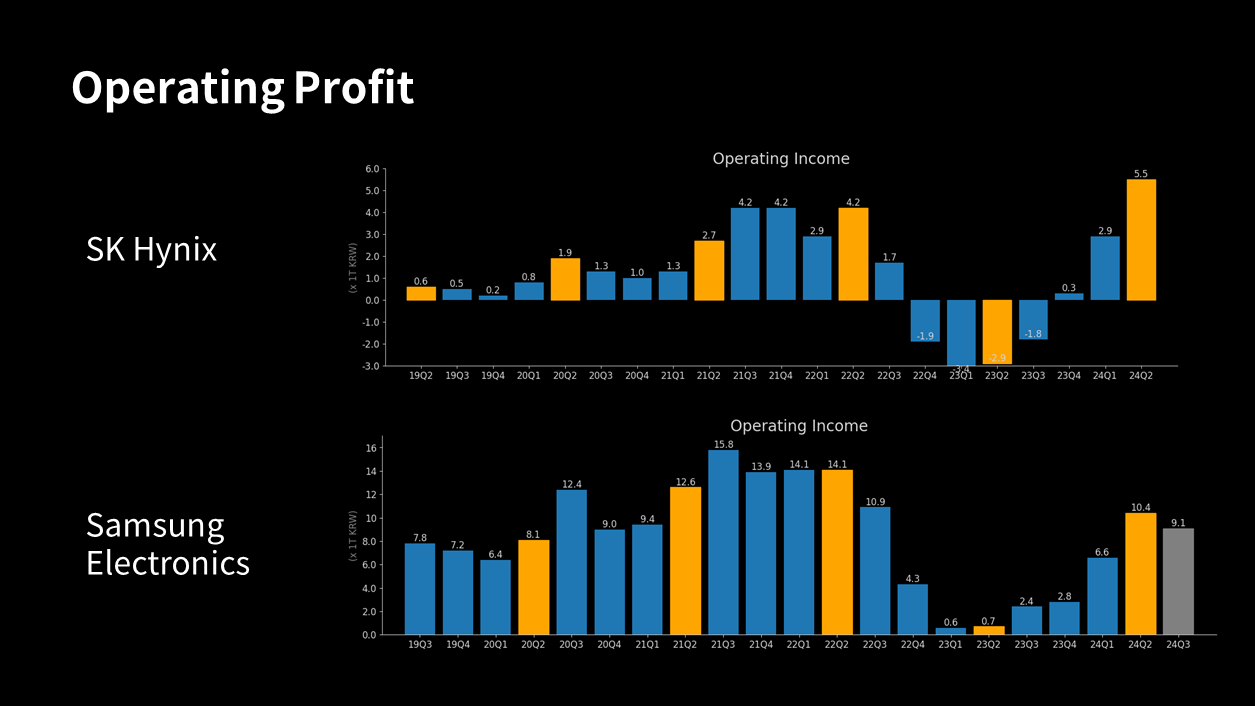
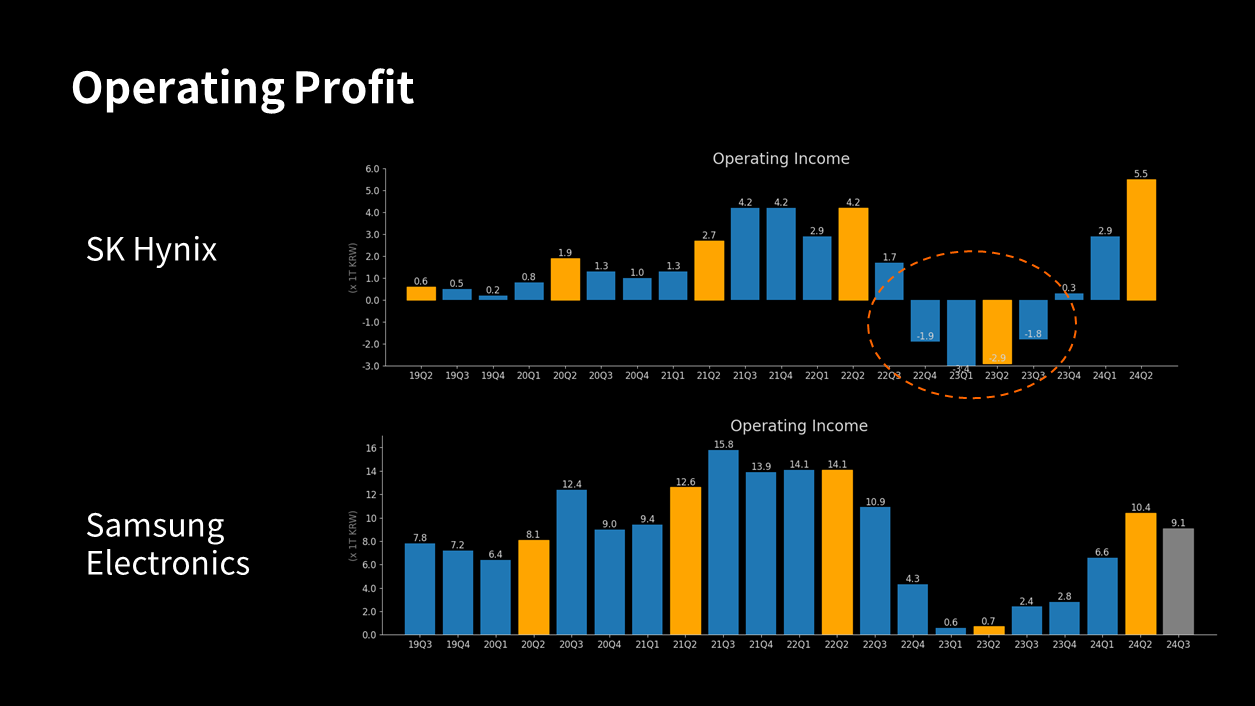
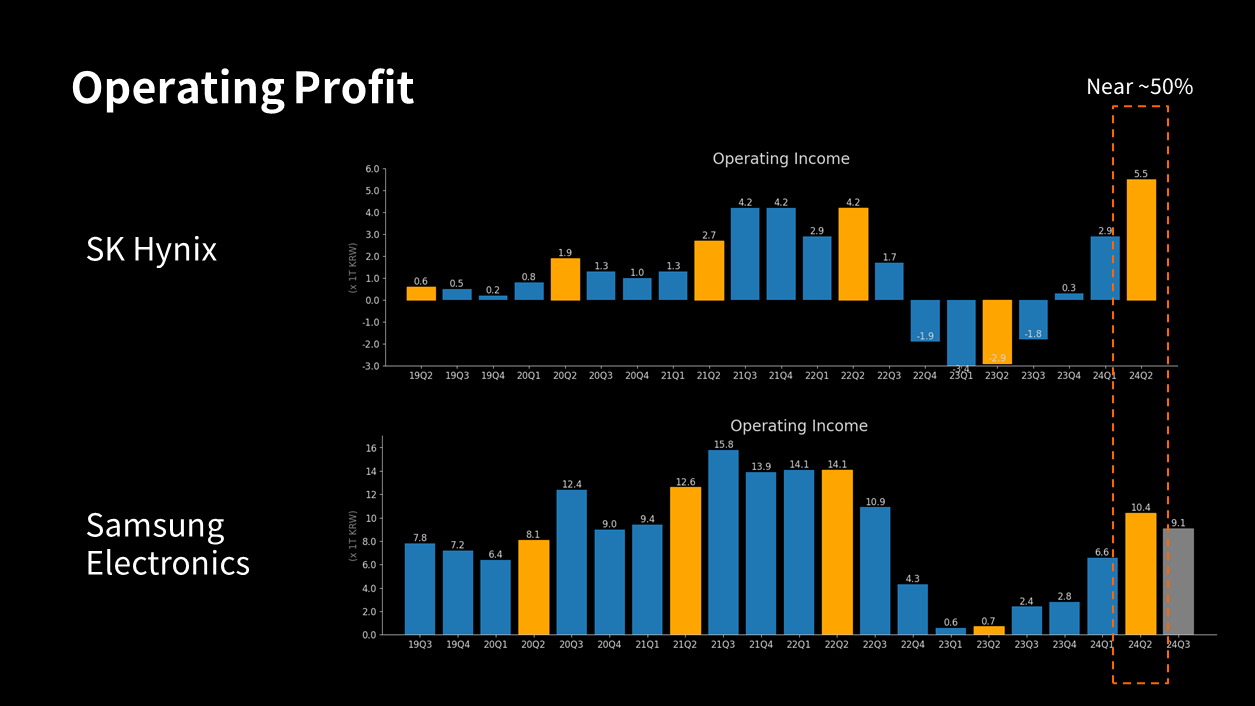
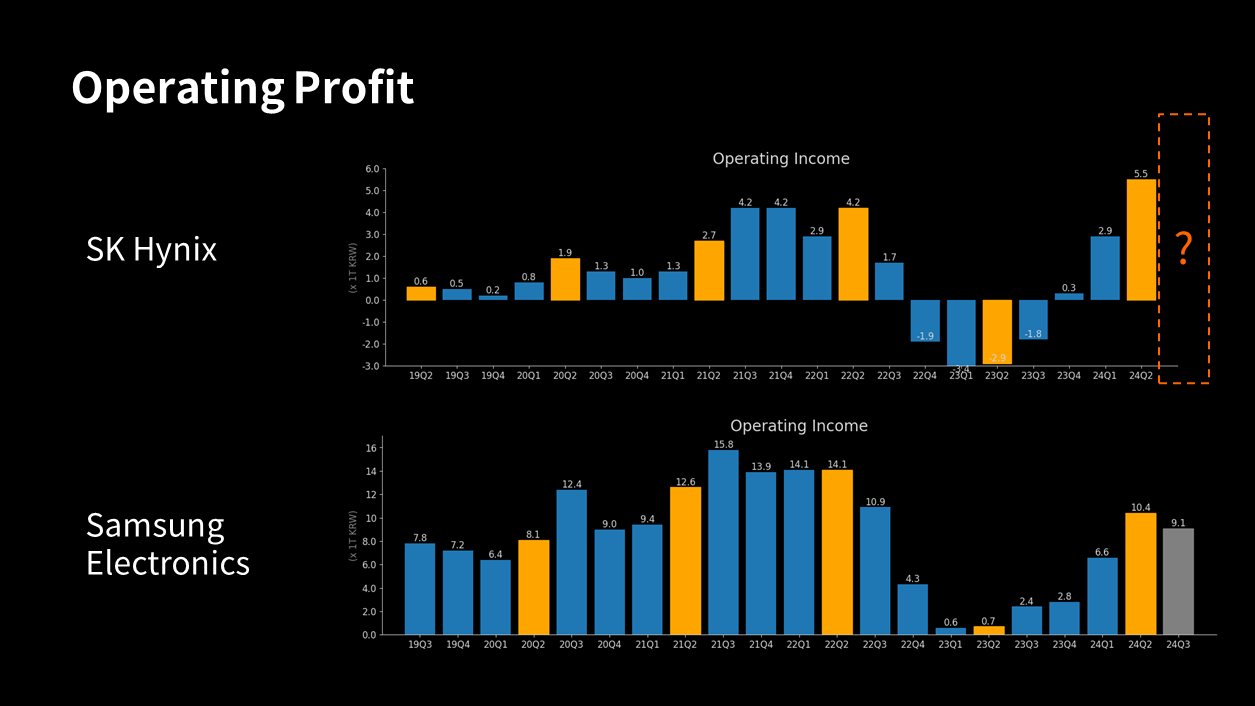
[1/2] In this video, we compare SK Hynix and Samsung Electronics, exploring their business structures, sales performances, and stock movements. Tune in for insights into the semiconductor sector and discover why the market views these companies so differently. This is not an investment recommendation, but rather an analytical overview. (p1) Lets compare and analyze whether SK Hynix is different from Samsung Electronics. Recently, Ive only been posting Shorts with AI voice, but Ive made a long video and will try to record it with my own voice as much as possible. (p2) Naturally, my videos are not investment recommendations. My goal is to provide insights through analysis. (p3) There are basic differences between SK Hynix and Samsung Electronics. SK Hynix has a business structure focused on memory semiconductors, and it has been evaluated to be ahead in HBM recently. Samsung Electronics, on the other hand, not only includes a semiconductor business that also covers nonmemory but also includes more business sectors such as smartphones, displays, and home appliances. Recently, there have been many articles and videos suggesting a total crisis. Therefore, a simple comparison is difficult, but since the current issues shaking both companies are similar regarding HBM, I will boldly compare them. (p4) Lets first take a look at the quarterly sales for the past five years. There is a scale difference between the graphs of the two companies, so please be mindful of that. SK Hynix hit the bottom in Q1 of 2023 and is showing a recovery since then. Especially, it grew significantly to an alltime high in Q2 of 2024. Due to its simpler business structure than Samsung Electronics, it has greater volatility. (p5) Since Samsung Electronics saw growth in sales in Q3 of 2024, it seems that Hynixs sales results should be better, so Im curious about how much it will be announced, whether it will be higher or lower than market consensus. (p6) Lets also compare the quarterly operating profits. (p7) Looking specifically at the semiconductor business, Samsung Electronics also experienced a loss of 15 trillion KRW in 2023, similar to Hynix. Since SK Hynix only has a memory business, its losses are more starkly revealed, and we can see that the scale of the losses was significant. (p8) However, looking at Q2 of 2024, we can see that Hynixs operating profit reached about 50% of Samsung Electronics. Considering the scale difference in sales, this can be regarded as quite a good performance. (p9) With the performance announcements for Q3 of 2024 imminent, it would be good to observe how they will be revealed. (p10) How have stock prices moved? Youtube Link - Issue Tracker

[3/3] Samsung Electronics Q2 2024 Performance Review

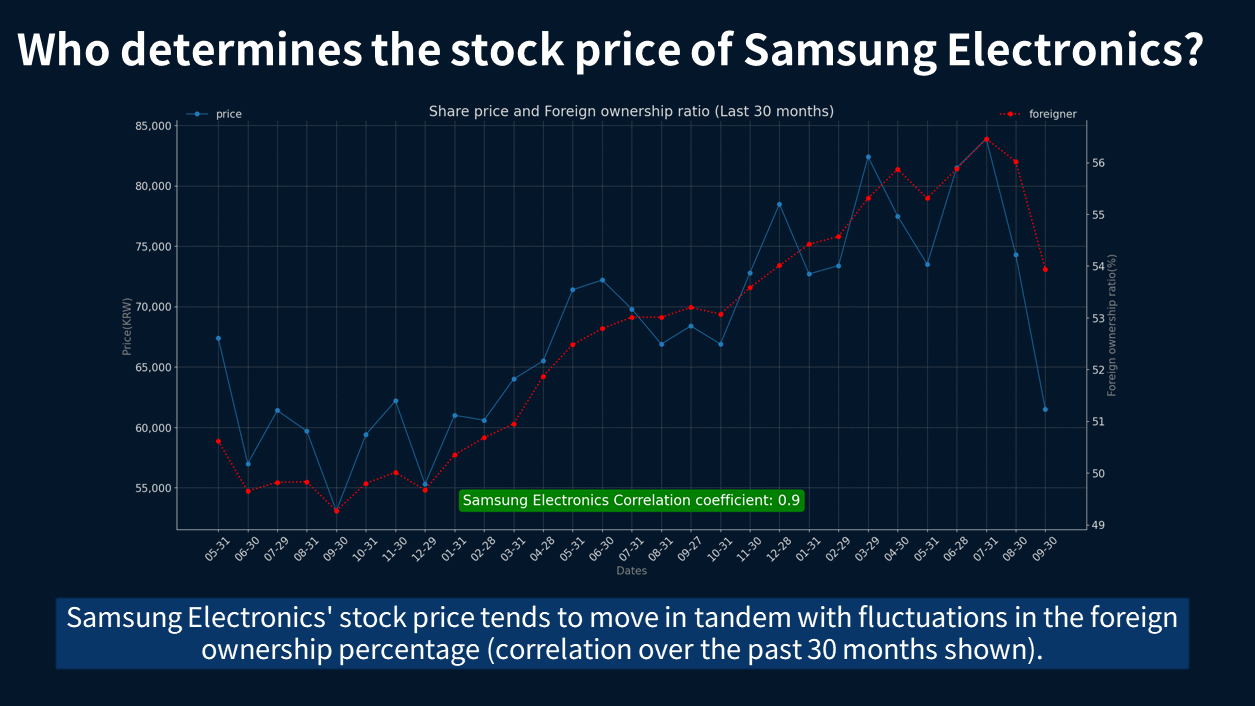
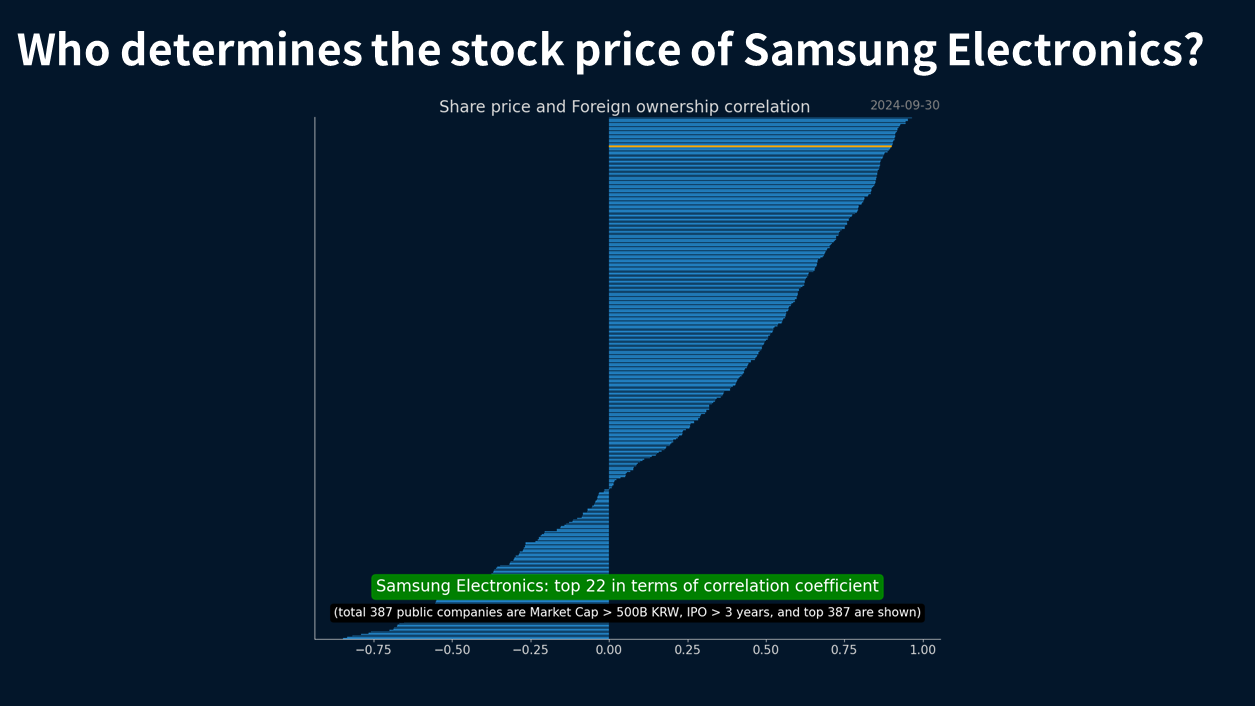
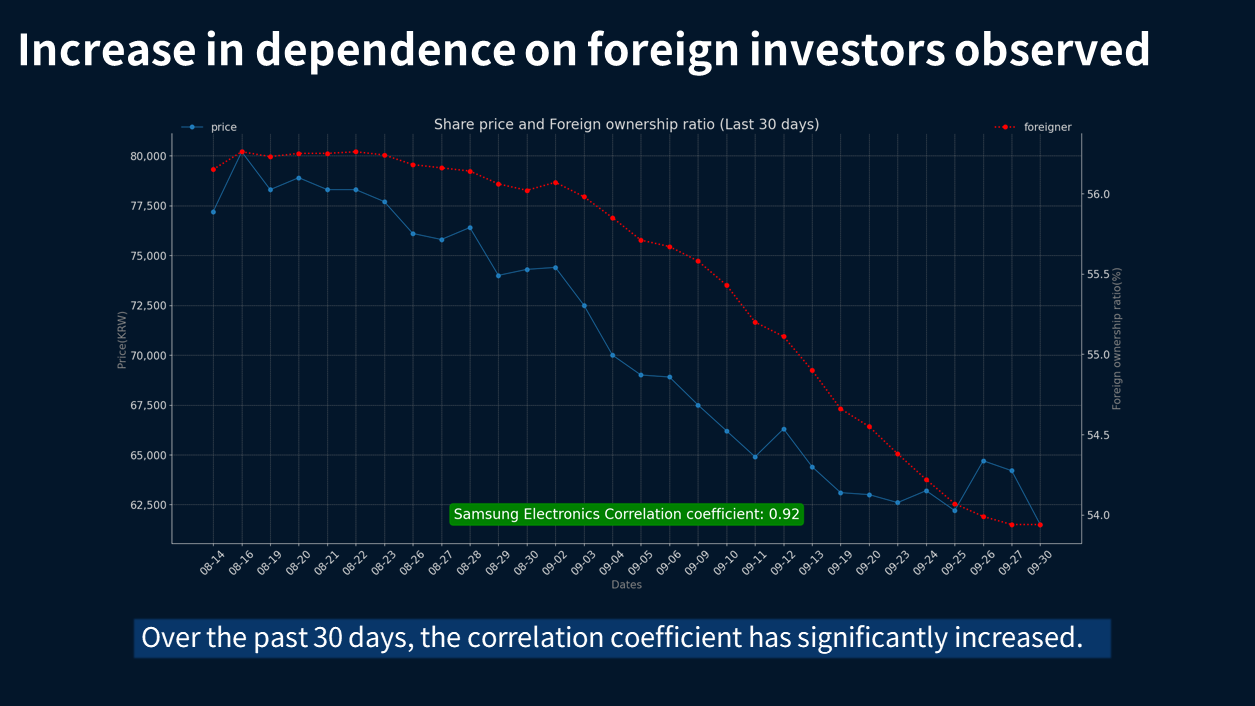
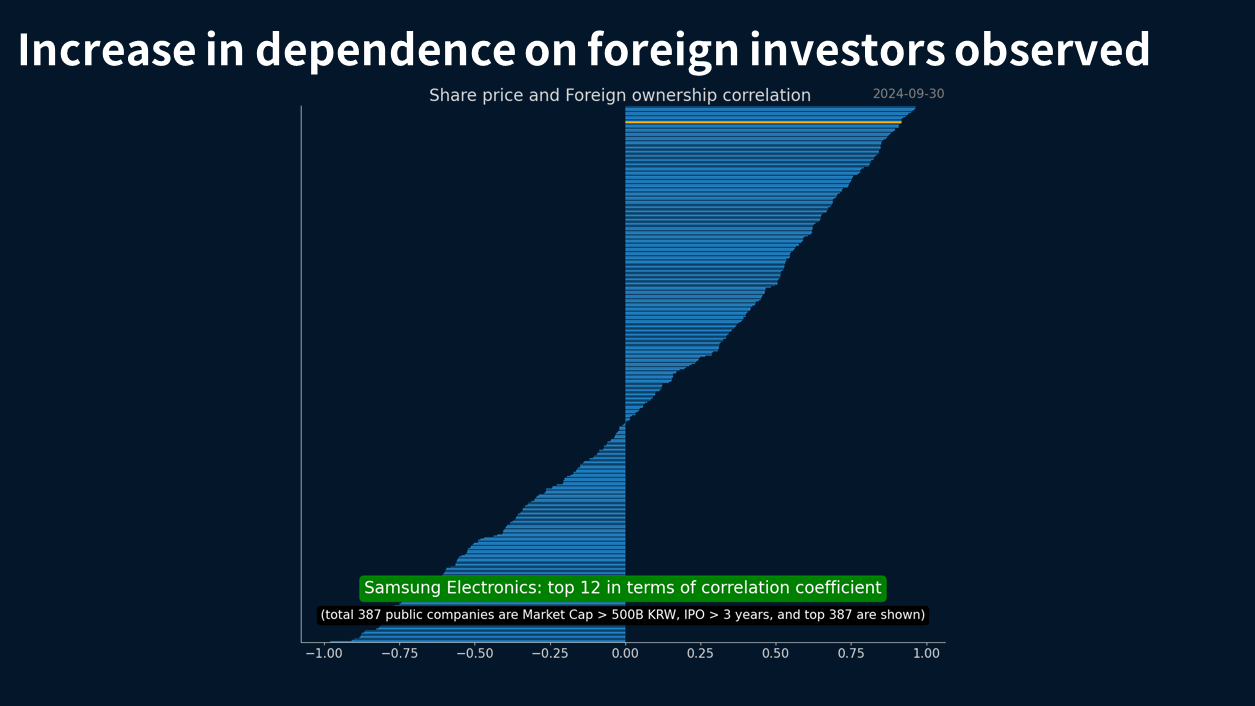
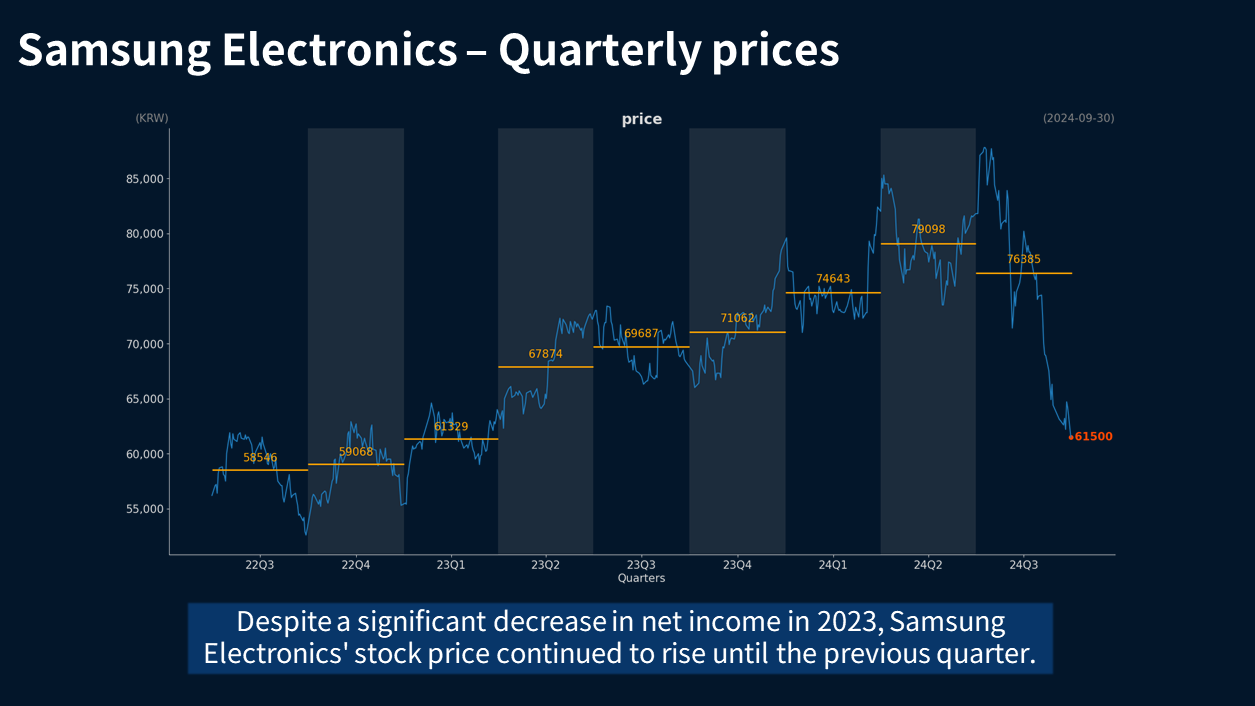
[3/3] Join us as we analyze Samsung Electronics' performance for Q2 2024. We explore revenue growth, stock price trends, and the factors impacting Samsung's valuation. Discover what this means for future investments! (p21) On the supply and demand side, Samsung Electronics stock price is significantly influenced by foreign investors. An analysis of the stock price and foreign ownership percentage over the past 30 months reveals a high correlation coefficient of 0.90, indicating a strong relationship between the two. This suggests that movements in foreign ownership tend to closely track changes in the stock price. (p22) Among large listed companies in South Korea, Samsung Electronics ranks in the top 22 for the size of the correlation coefficient regarding foreign ownership. In the graph, companies at the top exhibit a positive correlation between foreign ownership and stock price, while some companies at the bottom show an inverse relationship, where stock prices move contrary to foreign investor activity. This indicates varying degrees of sensitivity to foreign investment trends among different firms. (p23) Recently, the correlation coefficient has increased significantly. Calculating the same metric over the past 30 days shows that the correlation coefficient has risen to 0.92. This indicates that foreign investors have clearly driven the stock price movements of Samsung Electronics during this period. (p24) The overall ranking has significantly risen from 24th over the past 30 months to 12th based on the last 30 days.In conclusion, we will interpret how these changes in correlation and ranking relate to Samsungs overall market dynamics and investor sentiment. (p25) First, it can be said that earnings have recovered to average levels.Based on PER, the current stock price may still be overvalued.However, according to the supporting indicator PBR, it appears undervalued.Samsung Electronics has traditionally been a stock driven by foreign investors, and this trend seems to have intensified.Therefore, for Samsungs stock price to recover, it is crucial to restore expectations for both Samsung Electronics and the South Korean economy from a foreign perspective. (p26) This concludes todays video. This is the first video prepared by our quarterly performance team. If you have any questions, please feel free to ask, and well see you in the next video. Thank you! Youtube Link - Issue Tracker

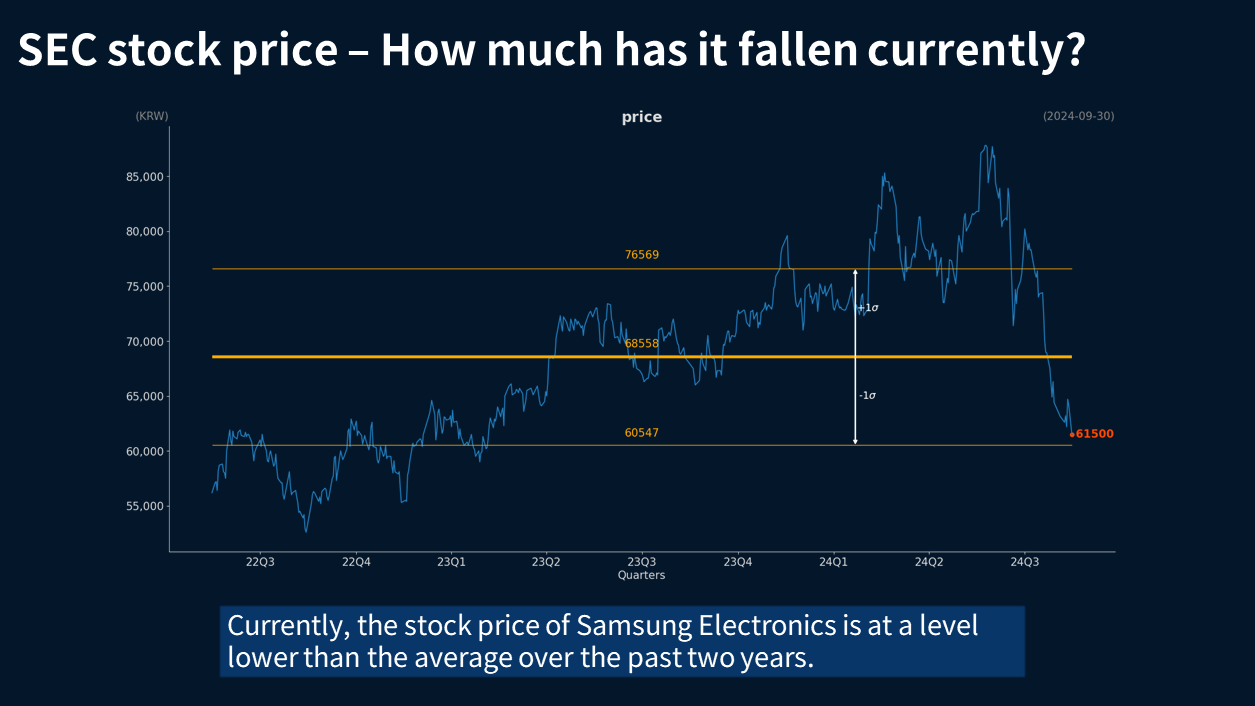
[2/3] Samsung Electronics Q2 2024 Performance Review

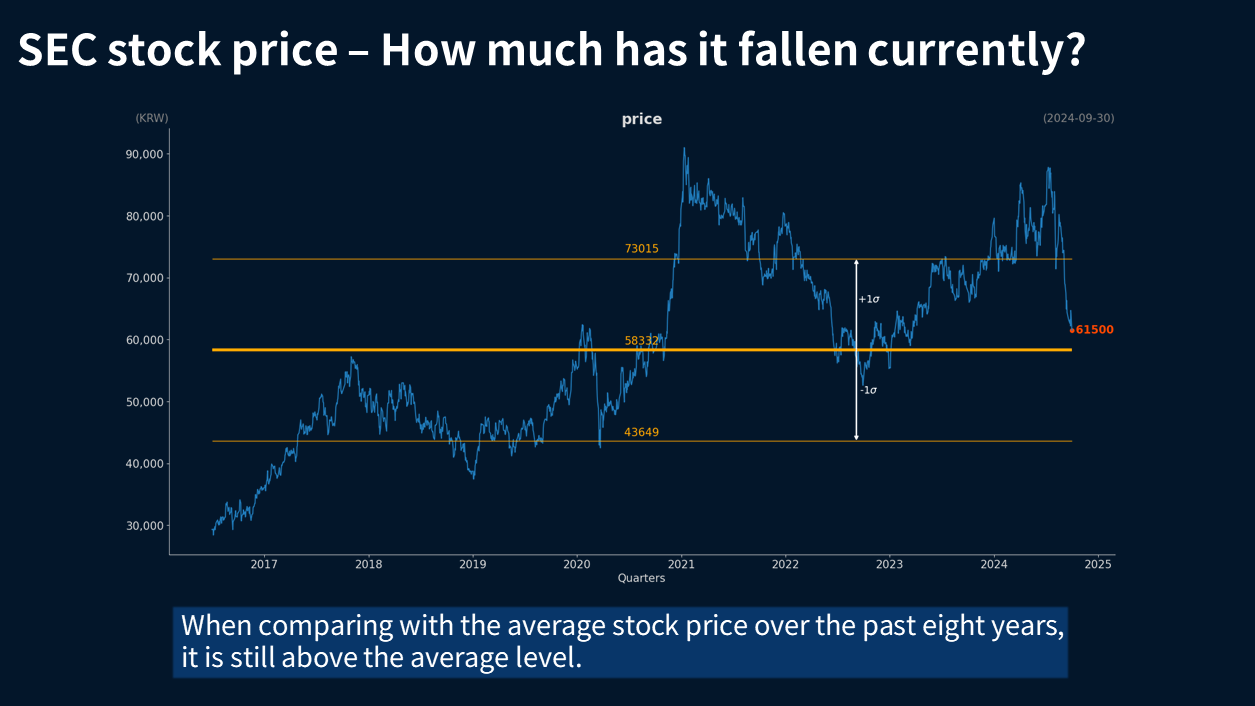
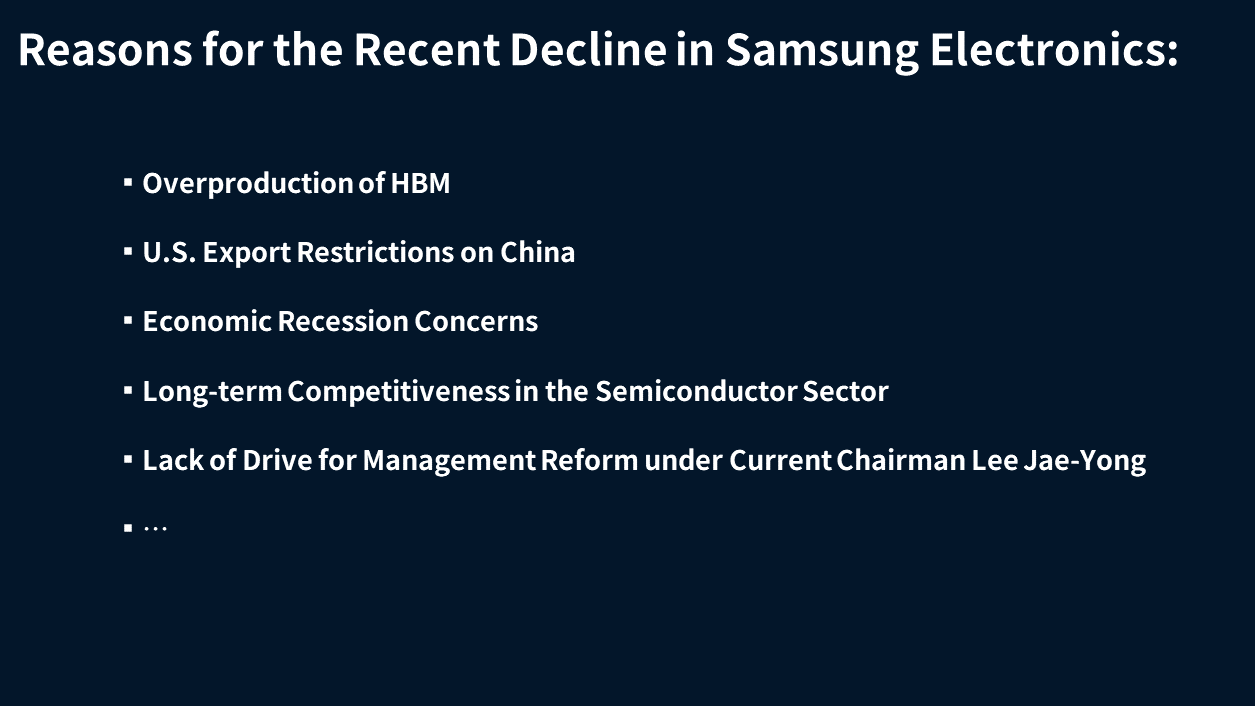
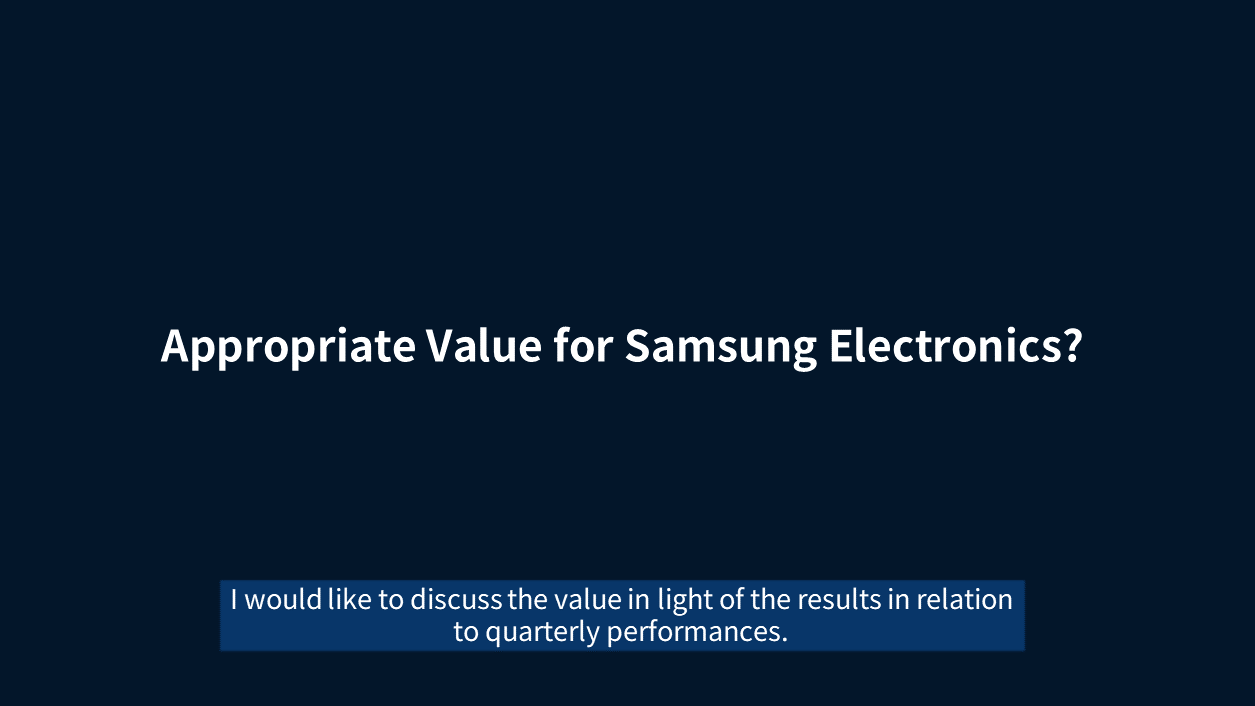
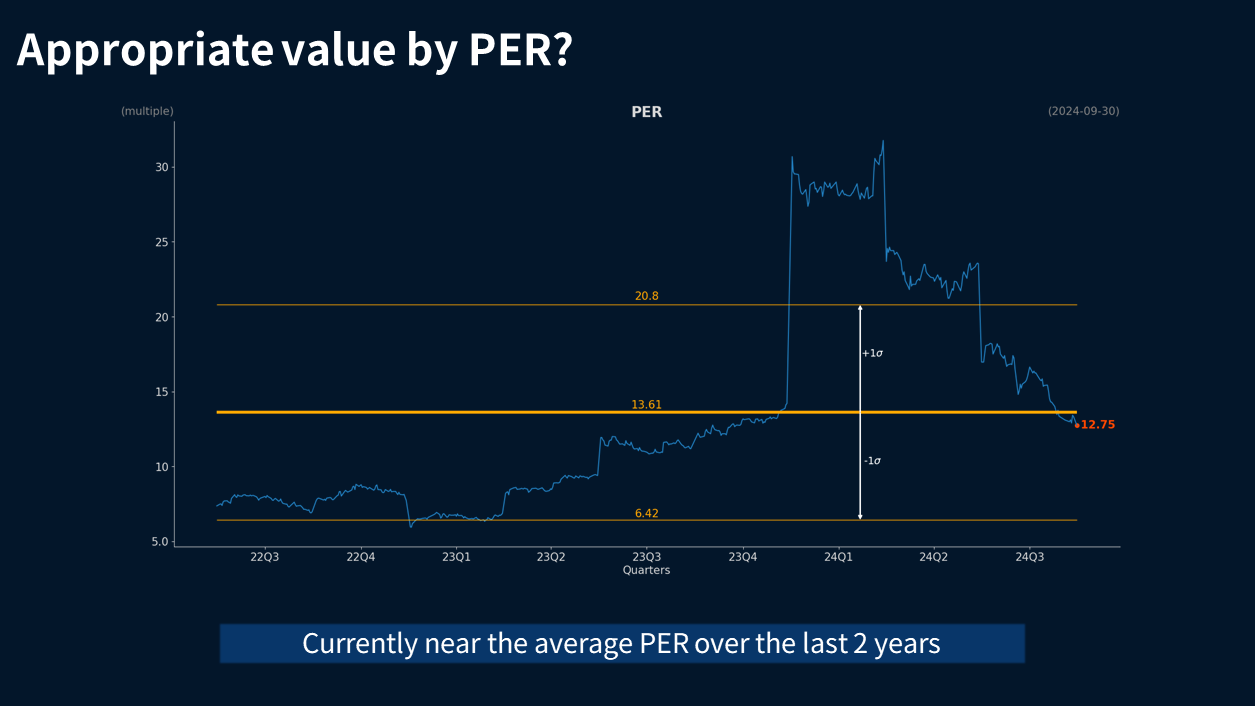
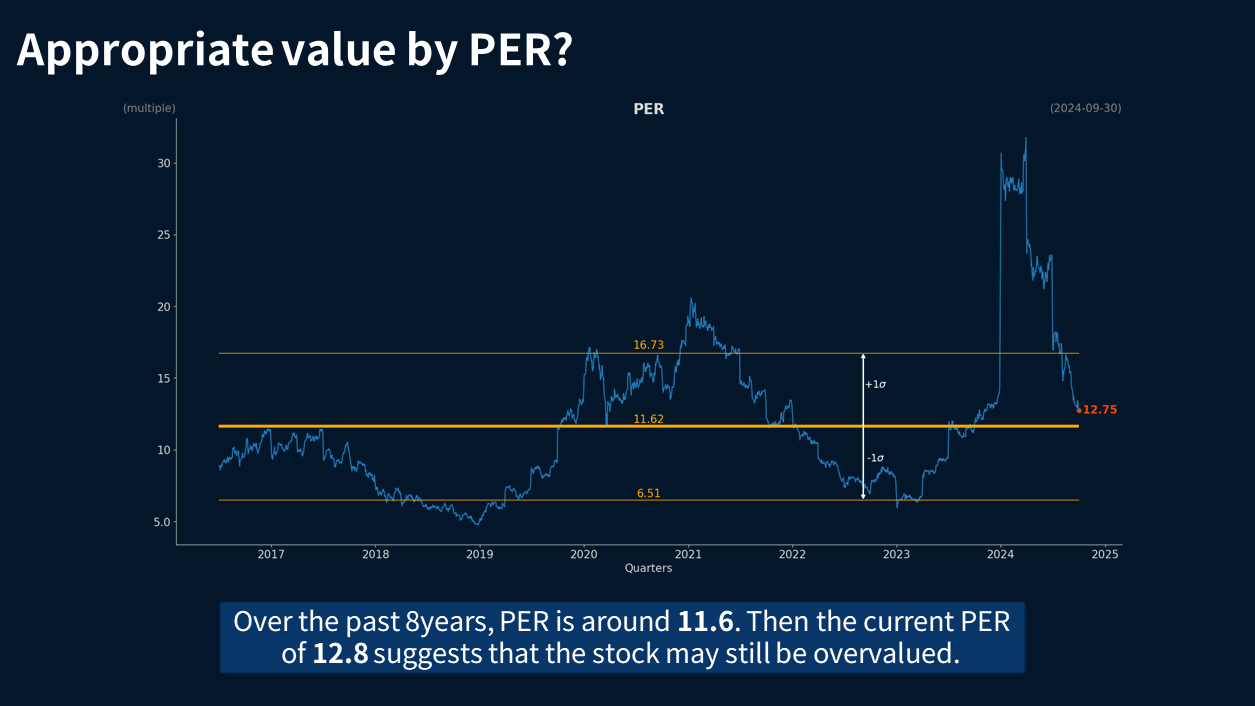
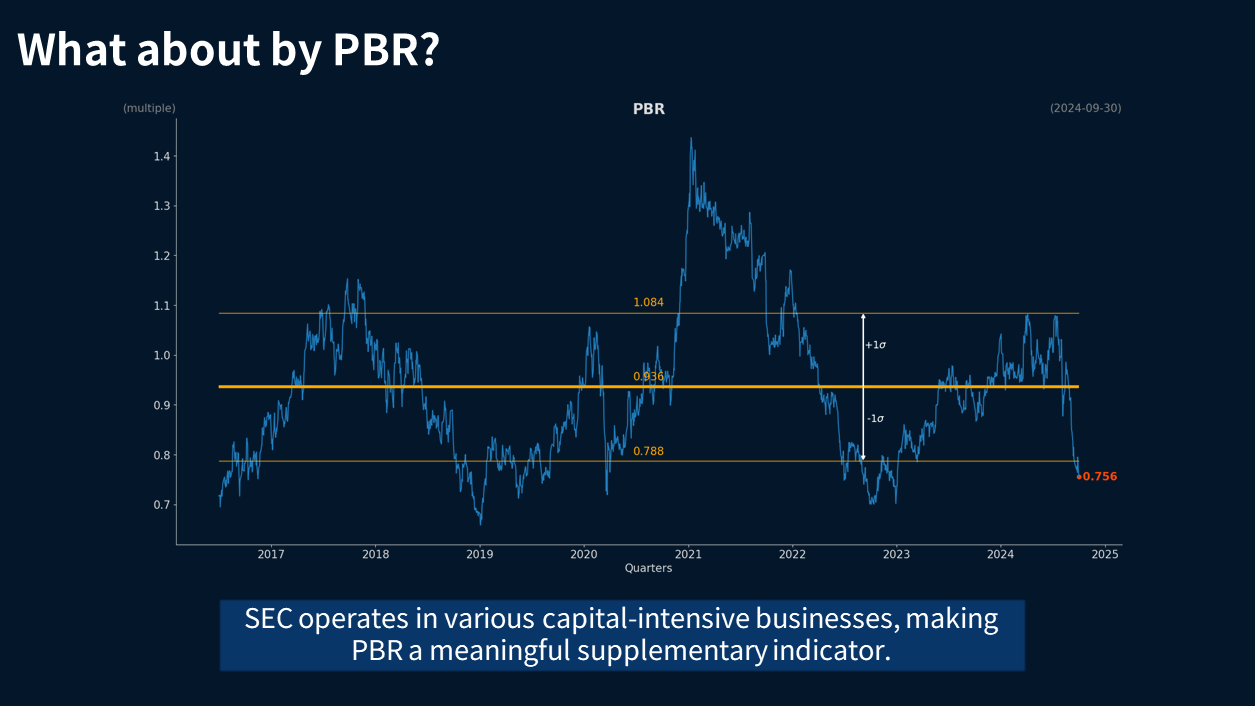
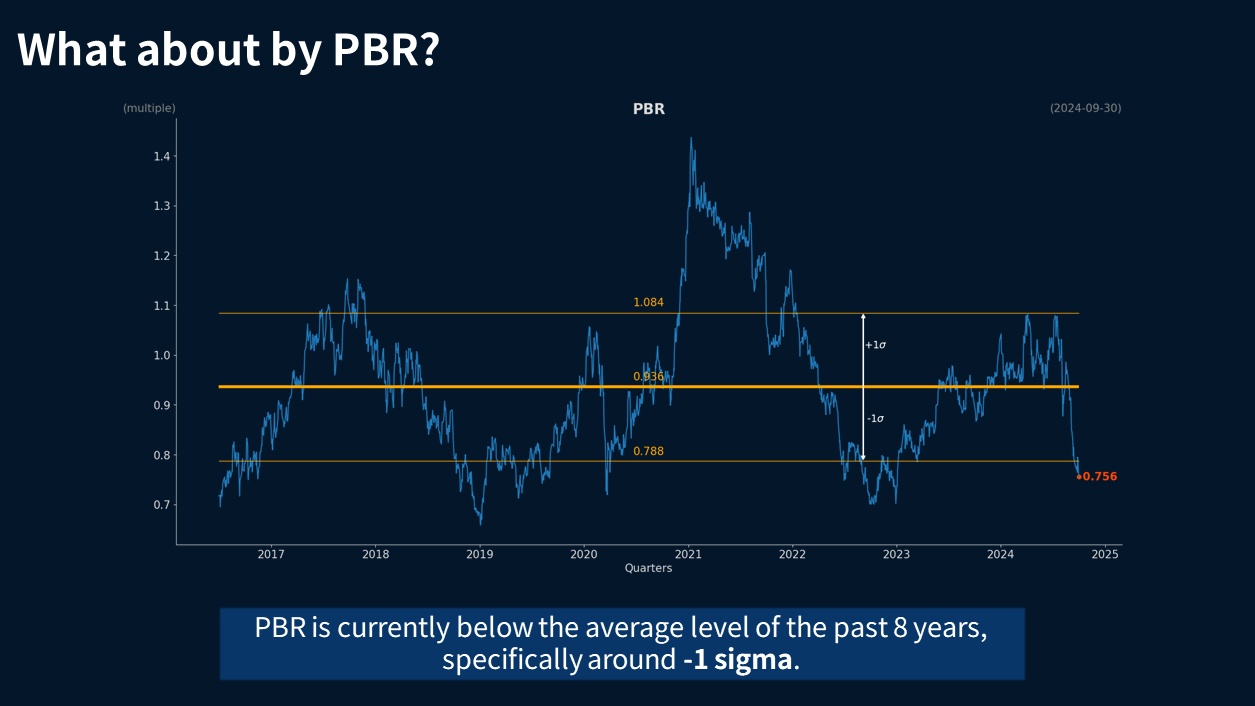
[2/3] Join us as we analyze Samsung Electronics' performance for Q2 2024. We explore revenue growth, stock price trends, and the factors impacting Samsung's valuation. Discover what this means for future investments! (p11) Lets examine the stock price in relation to performance. I calculated the average quarterly stock price over the past two years, and we can see that it has consistently risen until the previous quarter. This seems to be an unusual phenomenon, especially considering that the performance in 2023 was quite poor. There was a notable divergence between performance and stock price while performance declined, the stock price increased. Of course, performance is not the sole factor influencing stock prices, but we can say that the movements were contrary to expectations based on performance. (p12) As of the end of September, we will examine how much Samsung Electronics stock price has fallen. The average stock price over the past two years is 68,600 KRW, and it is currently at a lower level than this. (p13) Compared to the average stock price over the past eight years, current prices are still higher, but they are approaching that average rapidly. I briefly compared them with the average stock price, and after examining recent stock decline issues, I will also discuss the fair value of Samsung Electronics. (p14) The reasons for the recent decline in Samsung Electronics, in my view, are as follows. First, there are worries that there may already be an oversupply of HBM in the memory semiconductor sector, which has been widely reported in the media. Second, there are concerns that the U.S. export restrictions on China could negatively affect Samsungs relationships with its Chinese customers. Third, there are fears that the economic recession will lead to a general decline in performance across Samsungs nonsemiconductor divisions. Fourth, there are apprehensions regarding the lack of longterm competitiveness in the semiconductor sector. Lastly, unlike during the tenure of former Chairman Lee KunHee, there are concerns about whether Samsung can achieve management reform under the current leadership of Lee JaeYong, given the different social atmosphere and personal style. (p15) The most important question is always, What is the appropriate value for Samsung Electronics? We would like to discuss the value considering the performance results. (p16) The most important indicator is probably the PER. We calculated the rolling PER based on the previous four quarters by dividing the market capitalization by the earnings. Currently, the PER is 12.8, which shows a recent decline. Interestingly, while the performance in 2023 was very poor, the PER for 2024 has soared. This suggests that despite the poor earnings, the stock price did not drop, leading to a situation where the first and second quarters of 2024 were overvalued. (p17) When looking at the average PER over the past two years, we can see that the current PER is approaching the average level for that period. (p18) When looking at the average PER over the past eight years, it is around 11.6, and the current PER is somewhat higher than this level. This suggests that there may still be room for further declines in the stock price. (p19) On the other hand, the PricetoBook Ratio or PBR is typically a useful metric for financial institutions or capitalintensive companies. While Samsung Electronics engages in both B2B and B2C operations, it still involves largescale investments and possesses significant assets, which makes calculating PBR a valuable supplementary indicator. (p20) It can be observed that the current PBR is approximately 1 sigma lower than the average PBR over the past eight years. Here, sigma refers to the standard deviation, indicating that the drop is statistically significant. This suggests that the stock is trading at a notably lower valuation compared to its historical average, which could imply potential undervaluation. Youtube Link - Issue Tracker
[1/3] Samsung Electronics Q2 2024 Performance Review

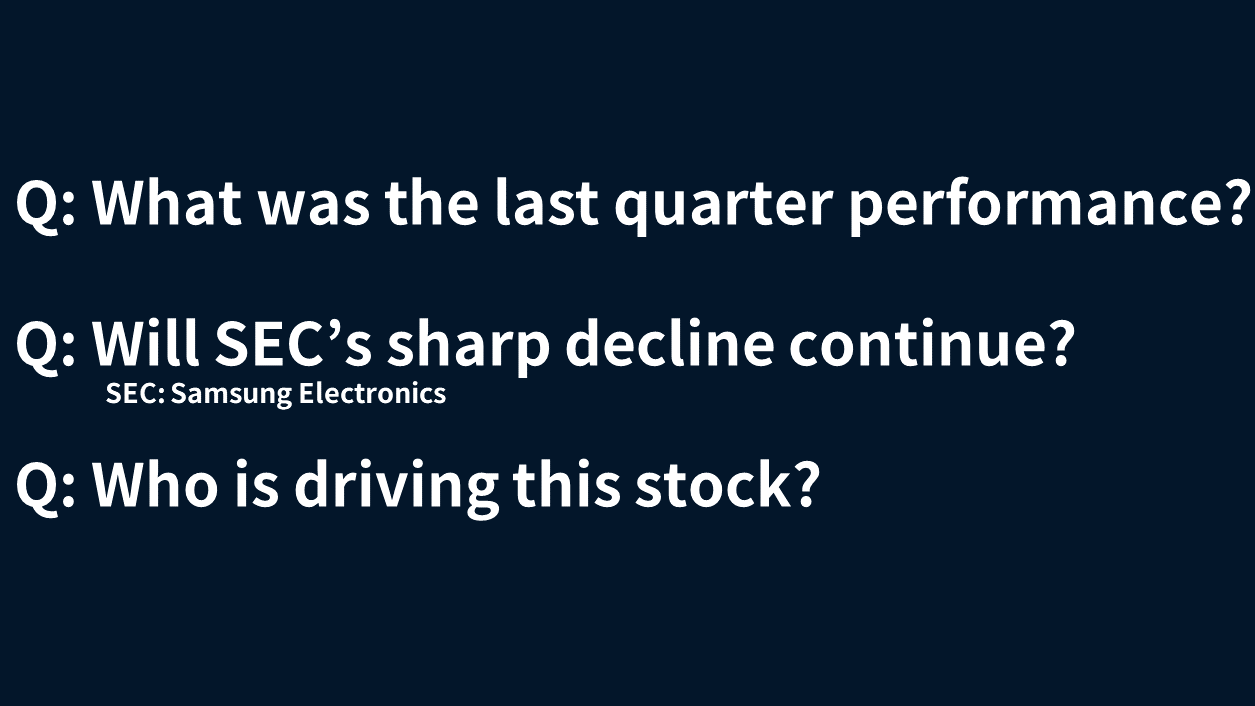
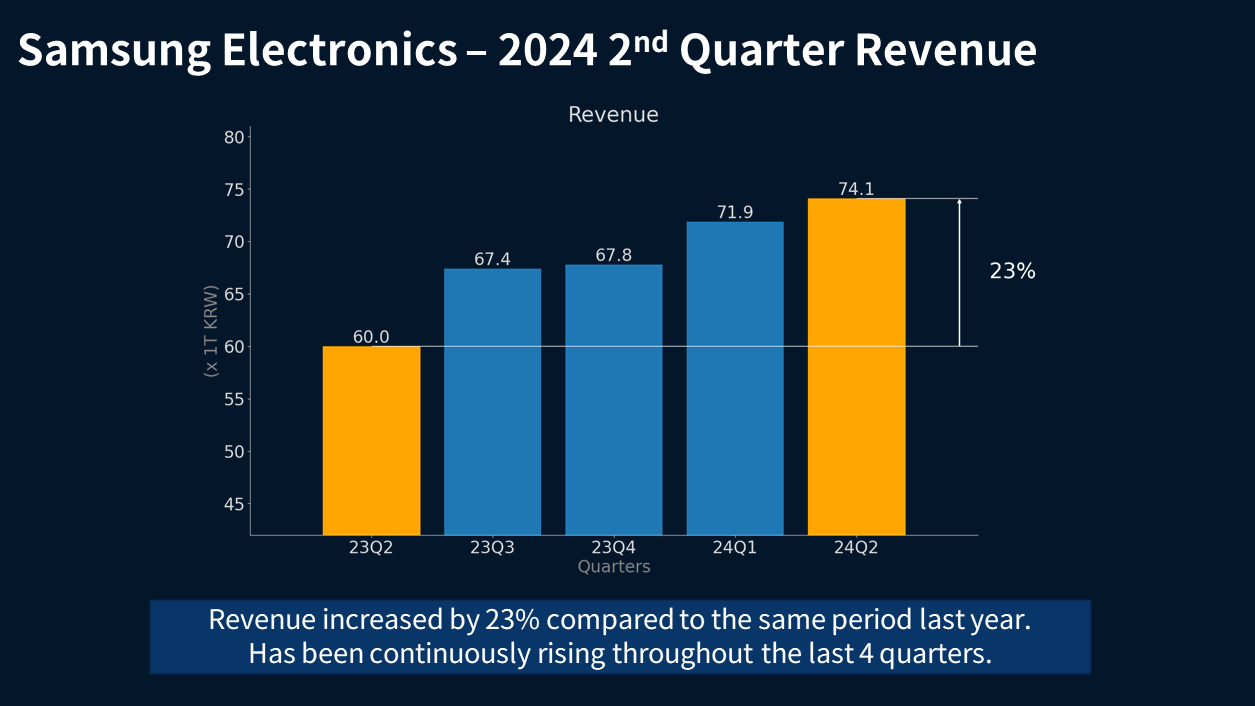
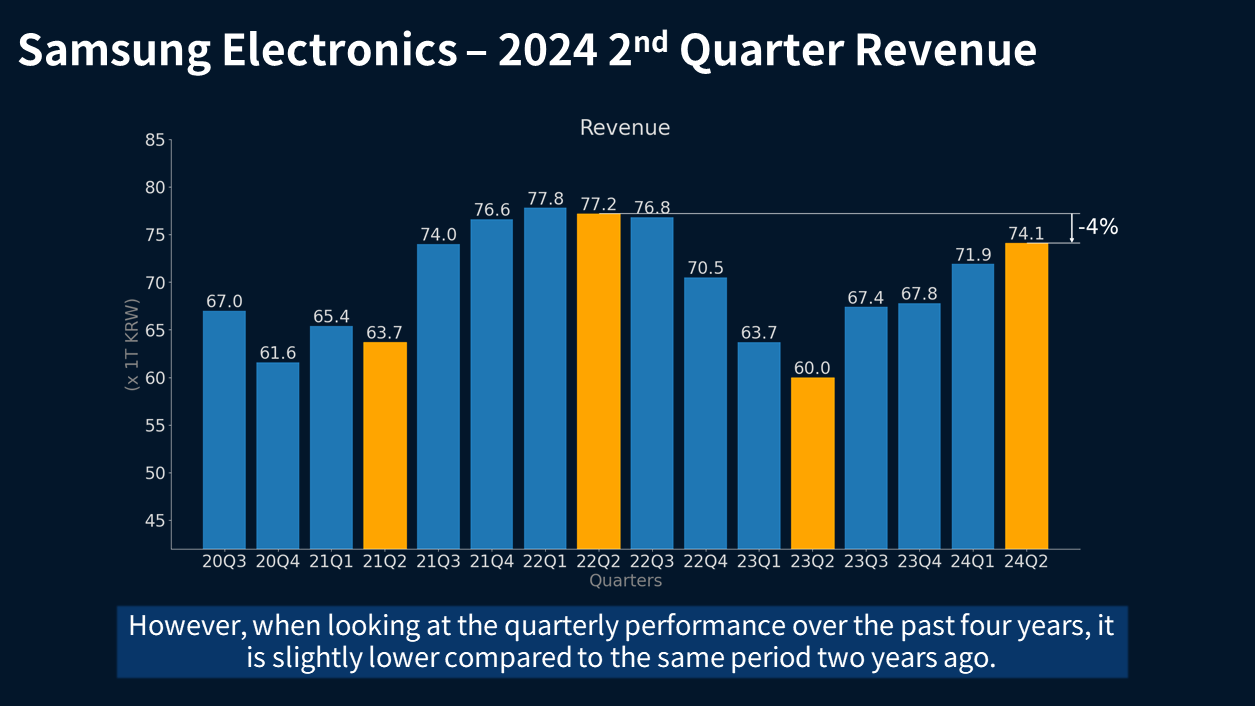
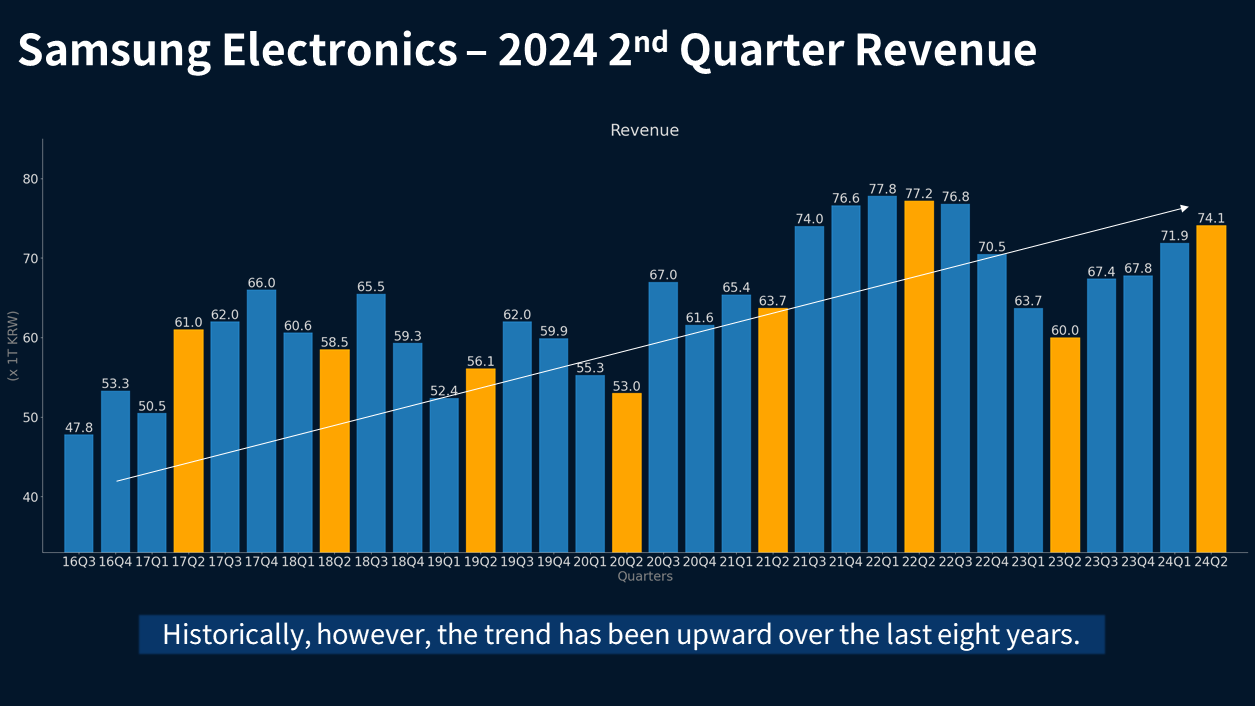
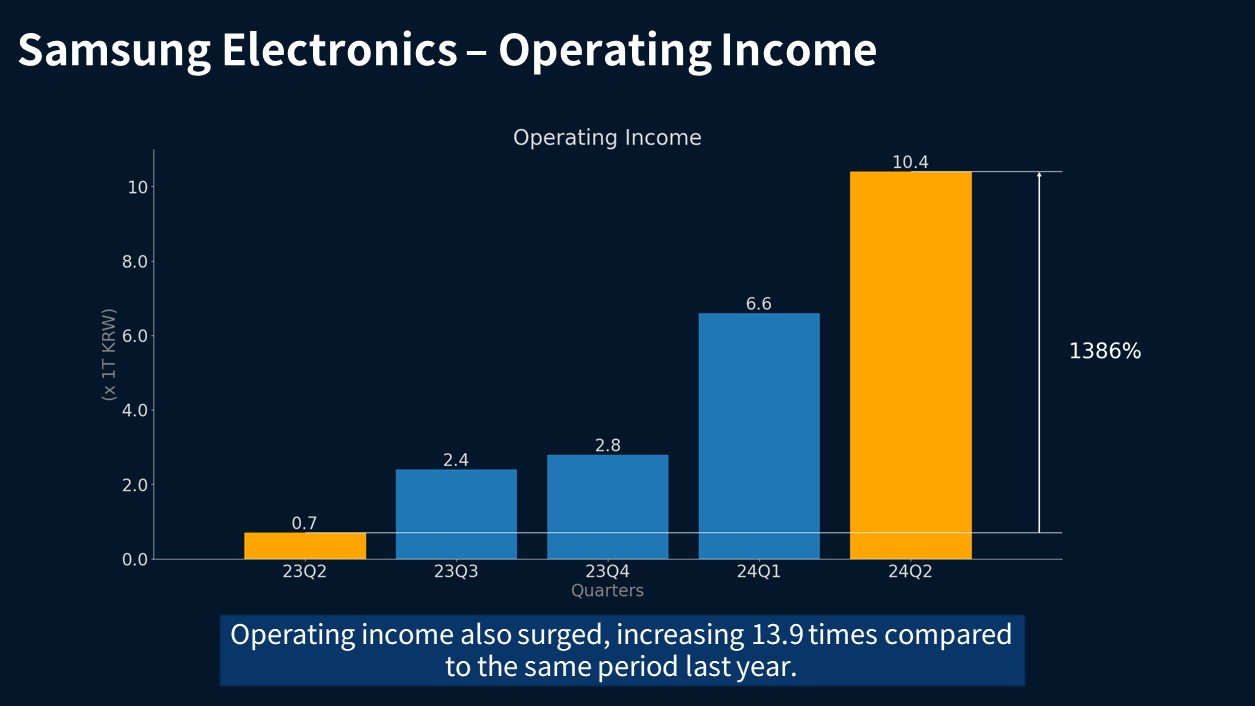
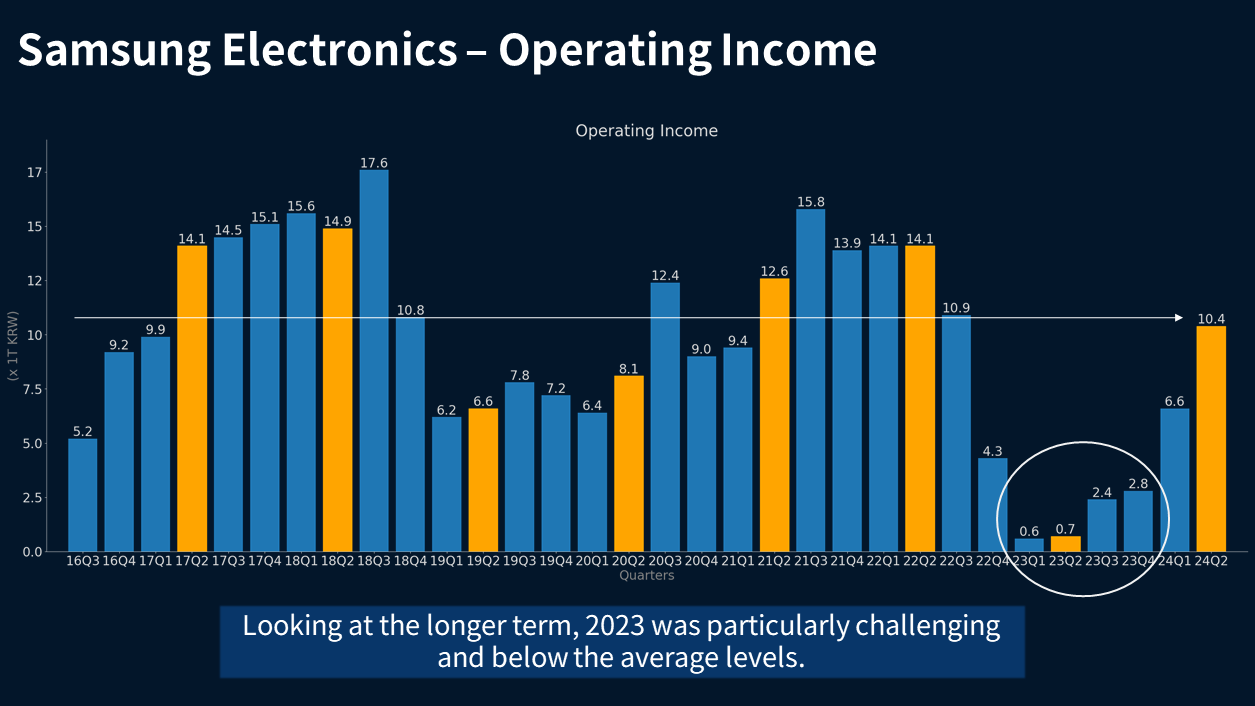
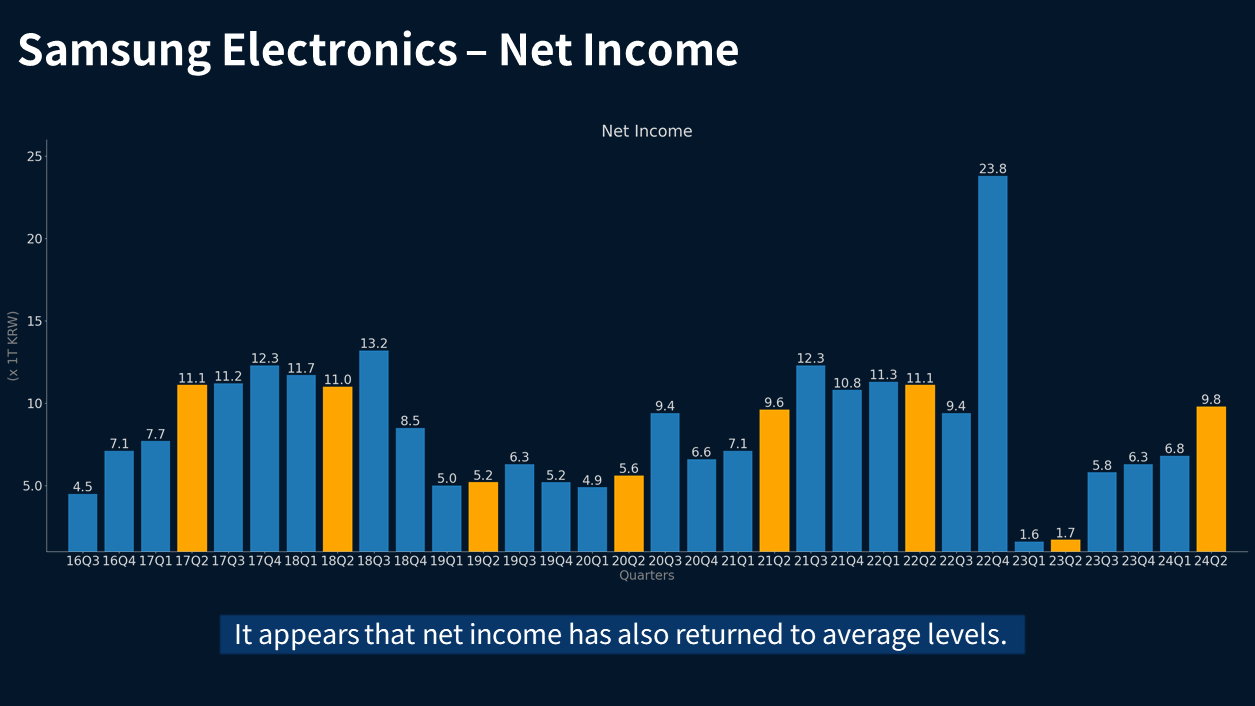
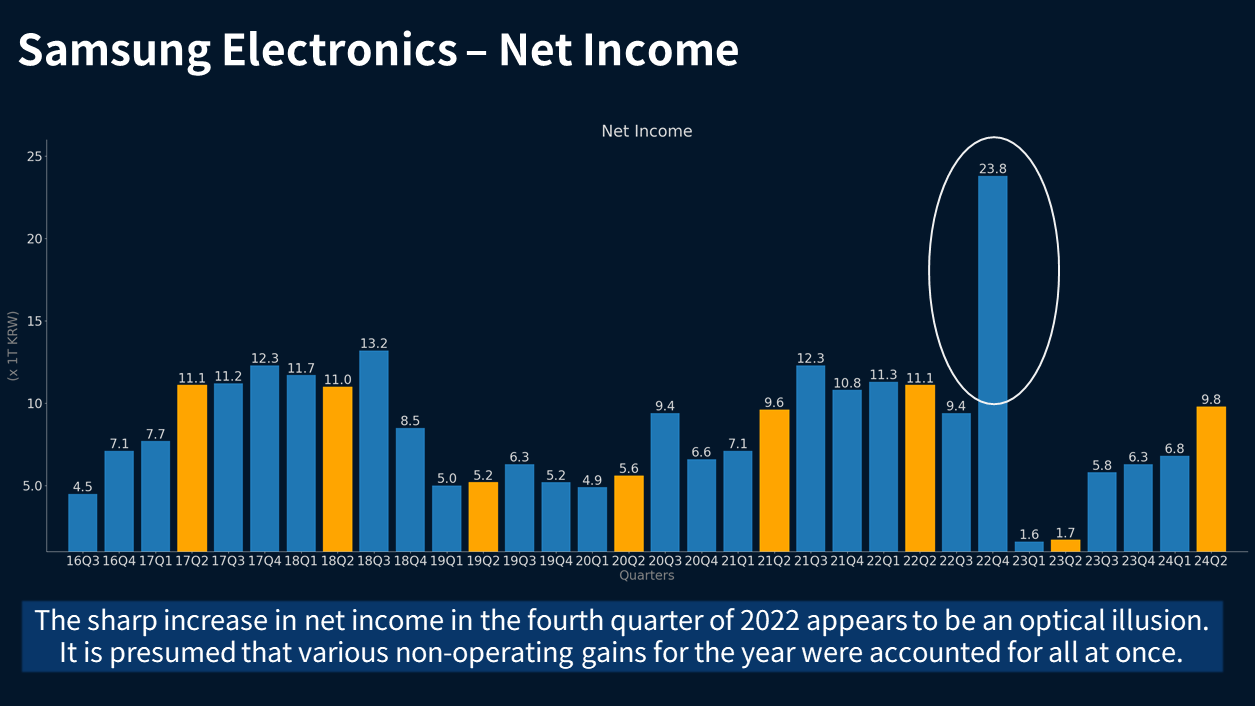
[1/3] Join us as we analyze Samsung Electronics' performance for Q2 2024. We explore revenue growth, stock price trends, and the factors impacting Samsung's valuation. Discover what this means for future investments! (p1) Lets analyze Samsung Electronics performance for the second quarter of 2024. (p2) Of course, it is not an investment recommendation. (p3) Three key questions we are addressing here.First, what was the last quarters performance of SEC? SEC is by the way Samsung Electronics?Second, will SECs sharp price decline continue?Lastly, who is driving this stock? (p4) In the second quarter of 2024, revenue reached 74 trillion KRW, marking a 23% increase compared to the second quarter of 2023. It has been continuously rising over the past four quarters. (p5) However, when looking at the quarterly performance over the past four years, it is minus 4 percent lower compared to the same period two years ago. (p6) Looking at quarterly revenue performance over the span of about eight years, we can still say that the overall trend is upward. It is natural for a growing company to experience rising revenue. (p7) The difference is even more pronounced when looking at operating income.In the second quarter of 2024, operating income is at around 10 trillion KRW. In comparison to the second quarter of 2023, it has increased approximately 13.9 times. This significant increase can be attributed to the poor performance in the second quarter of 2023. (p8) However, when considering the quarterly operating income over the past eight years, we can say that the performance in the second quarter of 2024 is approximately at the average level. In fact, it indicates that the operating income in 2023 was quite poor. (p9) A similar trend is observed in net income as well. In the second quarter of 2024, net income seems to have returned to average levels. However, its worth noting that the first half of 2023 was particularly poor. (p10) One notable point is the sharp increase in net income in the fourth quarter of 2022, which appears to be somewhat of an optical illusion. This surge seems to have resulted from the accounting for various nonoperating gains, such as asset sales and mergers and acquisitions, all being recorded in the fourth quarter of 2022. Since this is not directly related to todays topic, we will move on. Youtube Link - Issue Tracker